Tweet History is a new data graph that is available now for Enterprise clients. This new data graph allows you to view the retweets, quotes, and replies of a particular tweet as it grows over time. It also allows you to view the general growth rate, identify “second life”, KOLs, and view tweet’s reach across identifiable stakeholder categories.
Tweet History graph is available in the following dashboard widgets: Engaging Tweets, Trending Terms, Sentiment Analysis, and Visuals.
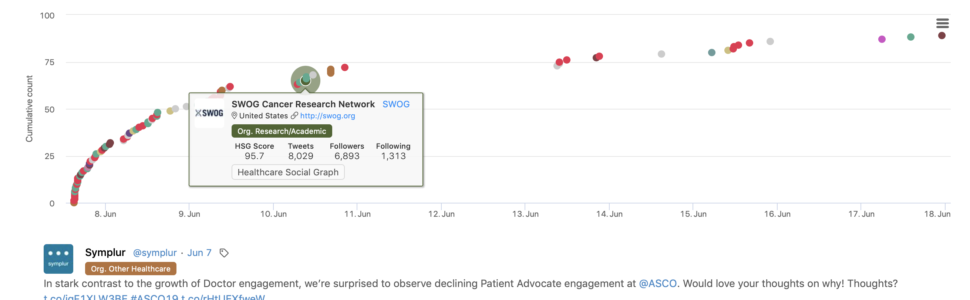
Click on the icon indicated below to view the Tweet History of this particular tweet.

Hover over each plot point to quickly view the profile details of the individual or org that engaged with the tweet. The plot points are color-coded according to their stakeholder categories when available.
When the plot points in the graph are clustered too close together you can “click-and-drag” to zoom in for a closer view of the points in the graph. Click on “Reset zoom” to return to the original view.
Learn more in our Help Article about Tweet History.