With the latest Network Analysis Advancements, we added many new UI controls that allows for a deeper understanding of a community. We have added another great feature — Community detection. The Community detection utilizes the Louvain method, an iterative algorithm for large and complex networks, that identifies and builds a hierarchy of communities and sub-communities.
With Community Detection, you can identify who is clustering with whom. Are the doctors only talking to other doctors or is there crossover? Are there geographical patterns to discover, are Canadians only taking to other Canadians, or are those speaking in Spanish only talking with other Spanish speakers? During a conference, do we see physicians who cluster around certain pharmaceutical companies? For healthcare news media, who is supporting and engaging with certain publishers or journals?
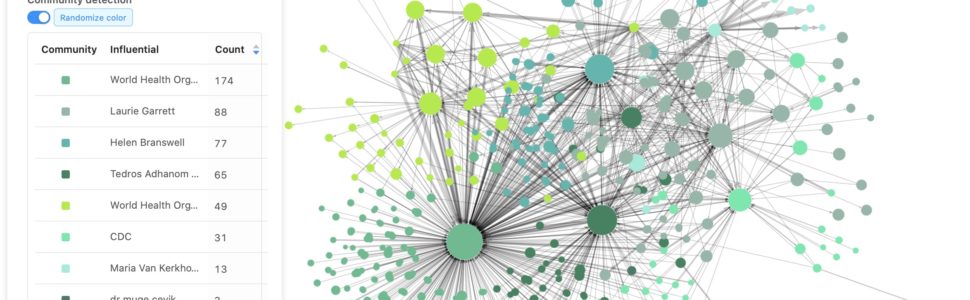
Toggle on the Community Detection and different colors are assigned to each community detected in the network graph. Toggle off and the profiles return to the stakeholder color of the profile. A table lists all the communities from the largest to the smallest with its assigned color, the name of the most influential profile of that community, and the size of the community.
You can also access any Twitter profile’s network graph by clicking on the profile of interest, then clicking on “Interactions” to view its network graph. The same features are also available here for you to further analyze this network graph filtered for this profile, including Community detection.