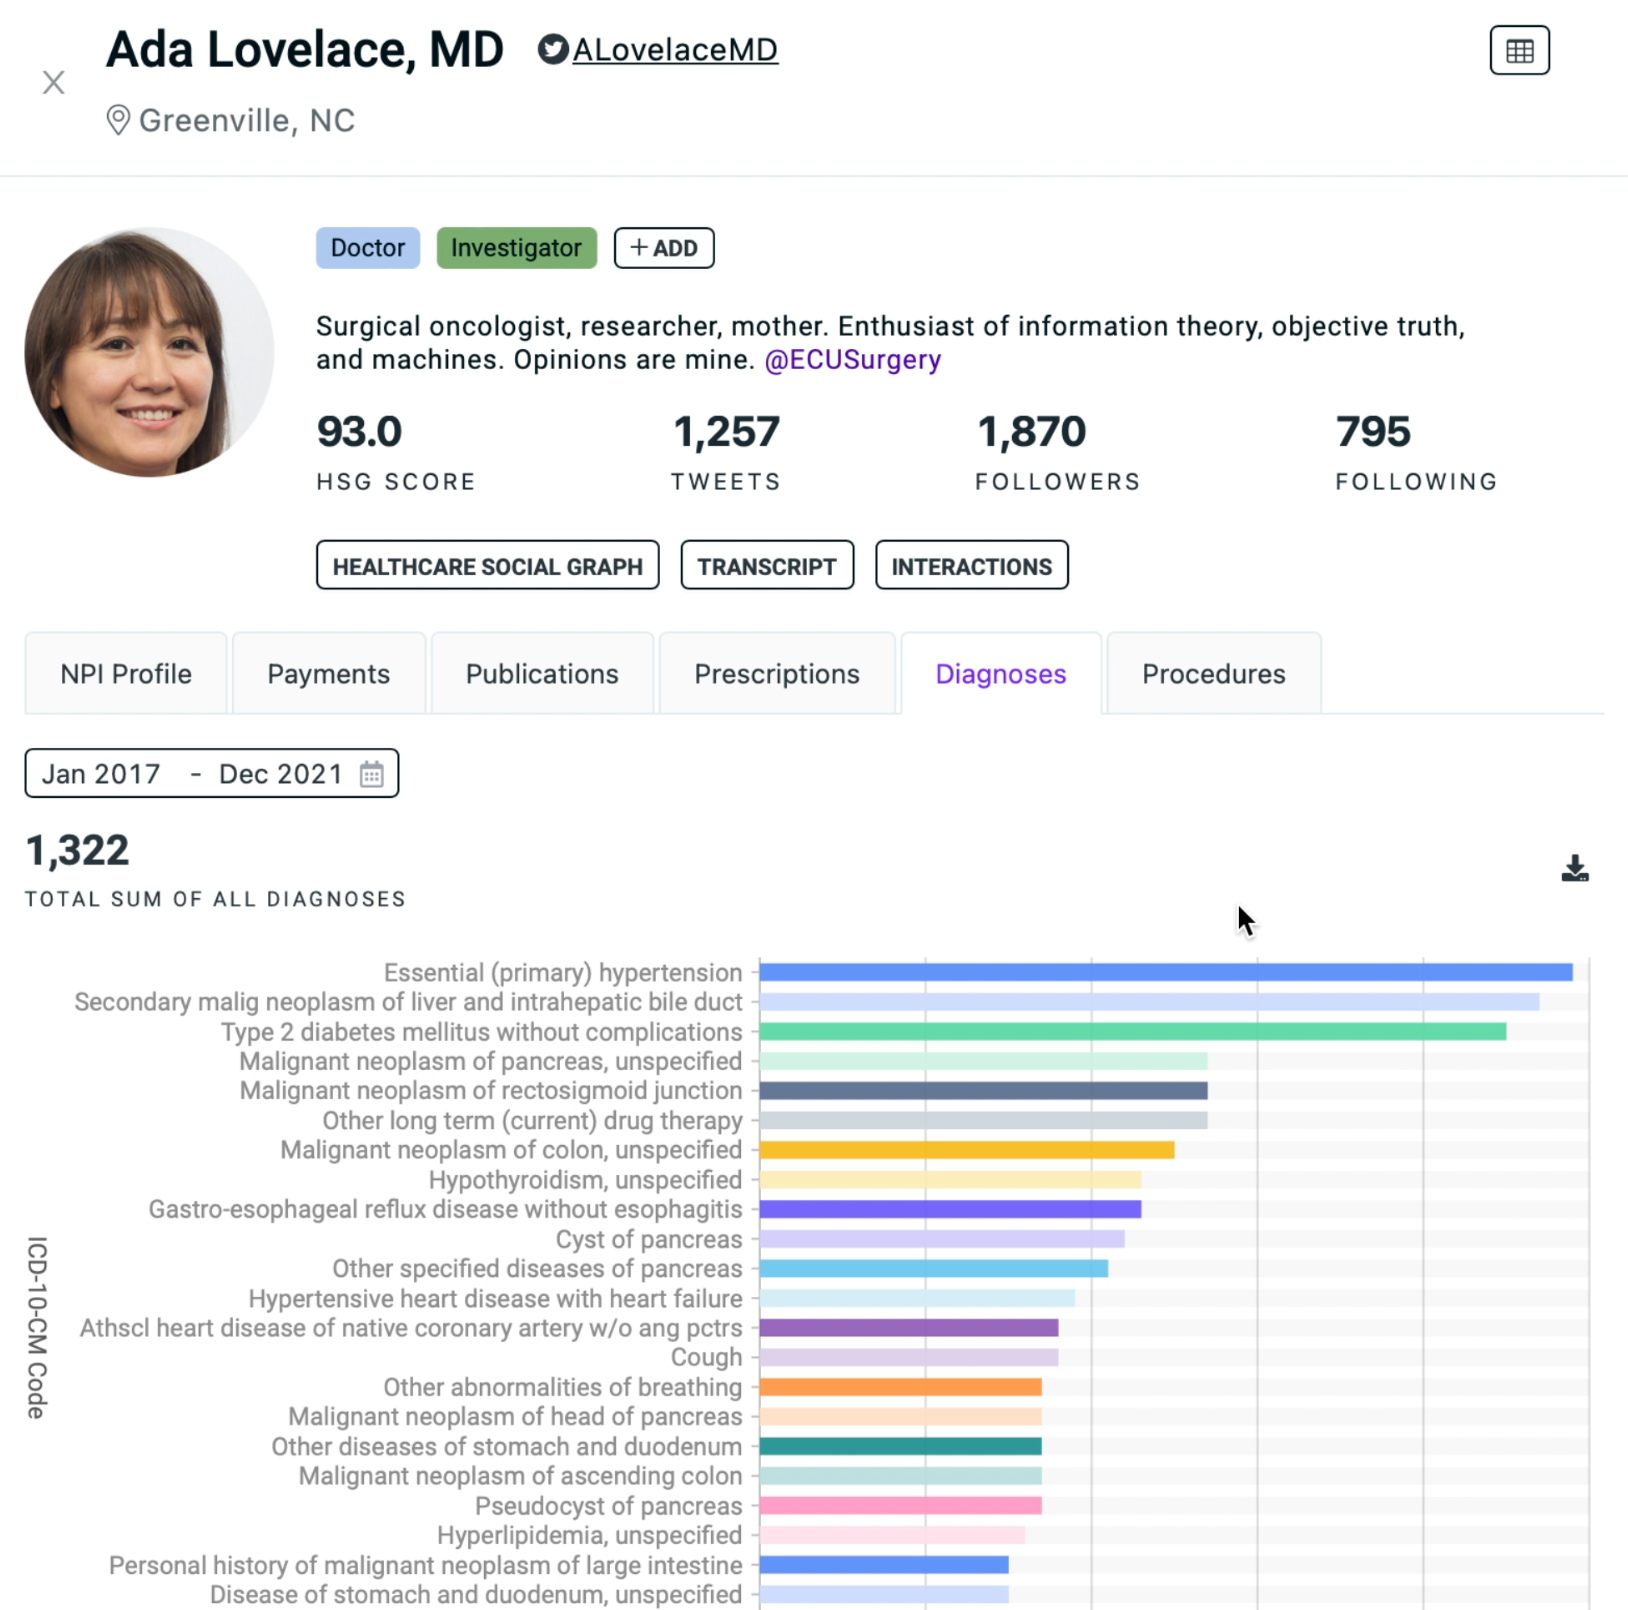
We’re excited to ship another HCP profile enrichment in Symplur. With a single click, you can now get an understanding of the diagnoses (ICD-10) a HCP sees within their practice … Continued
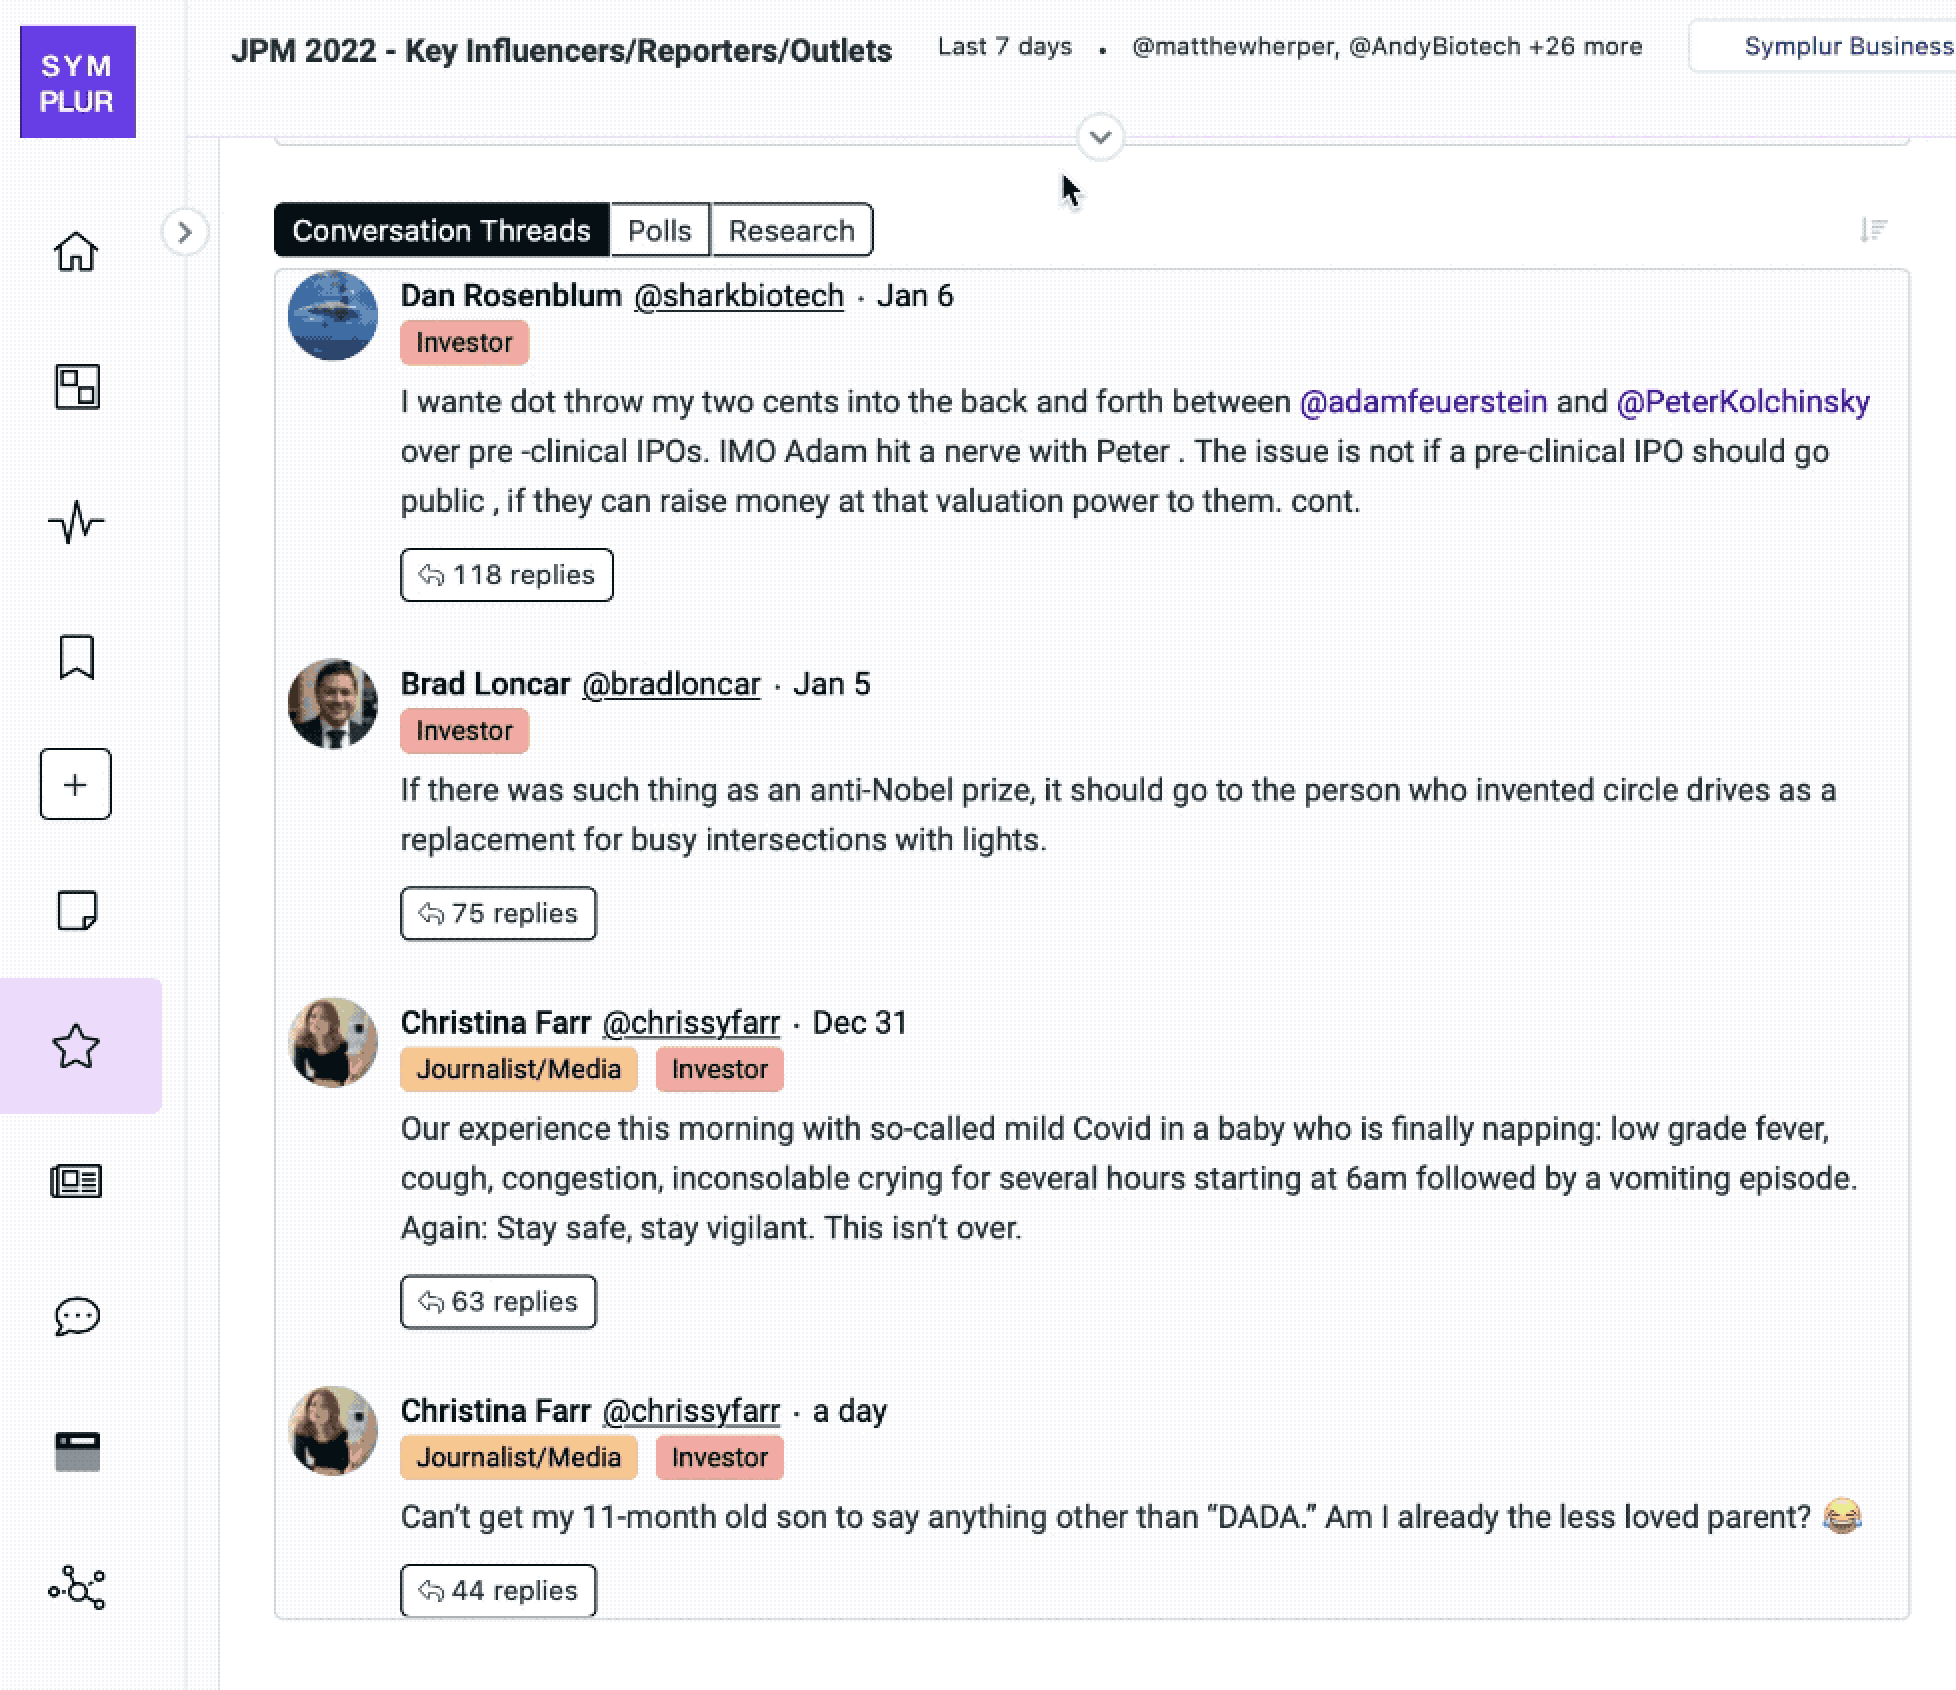
Just in time for J.P. Morgan Healthcare Conference, “Investor” stakeholder labels are now in Symplur. Social profiles with this stakeholder label is defined as “person who identifies as an investor … Continued
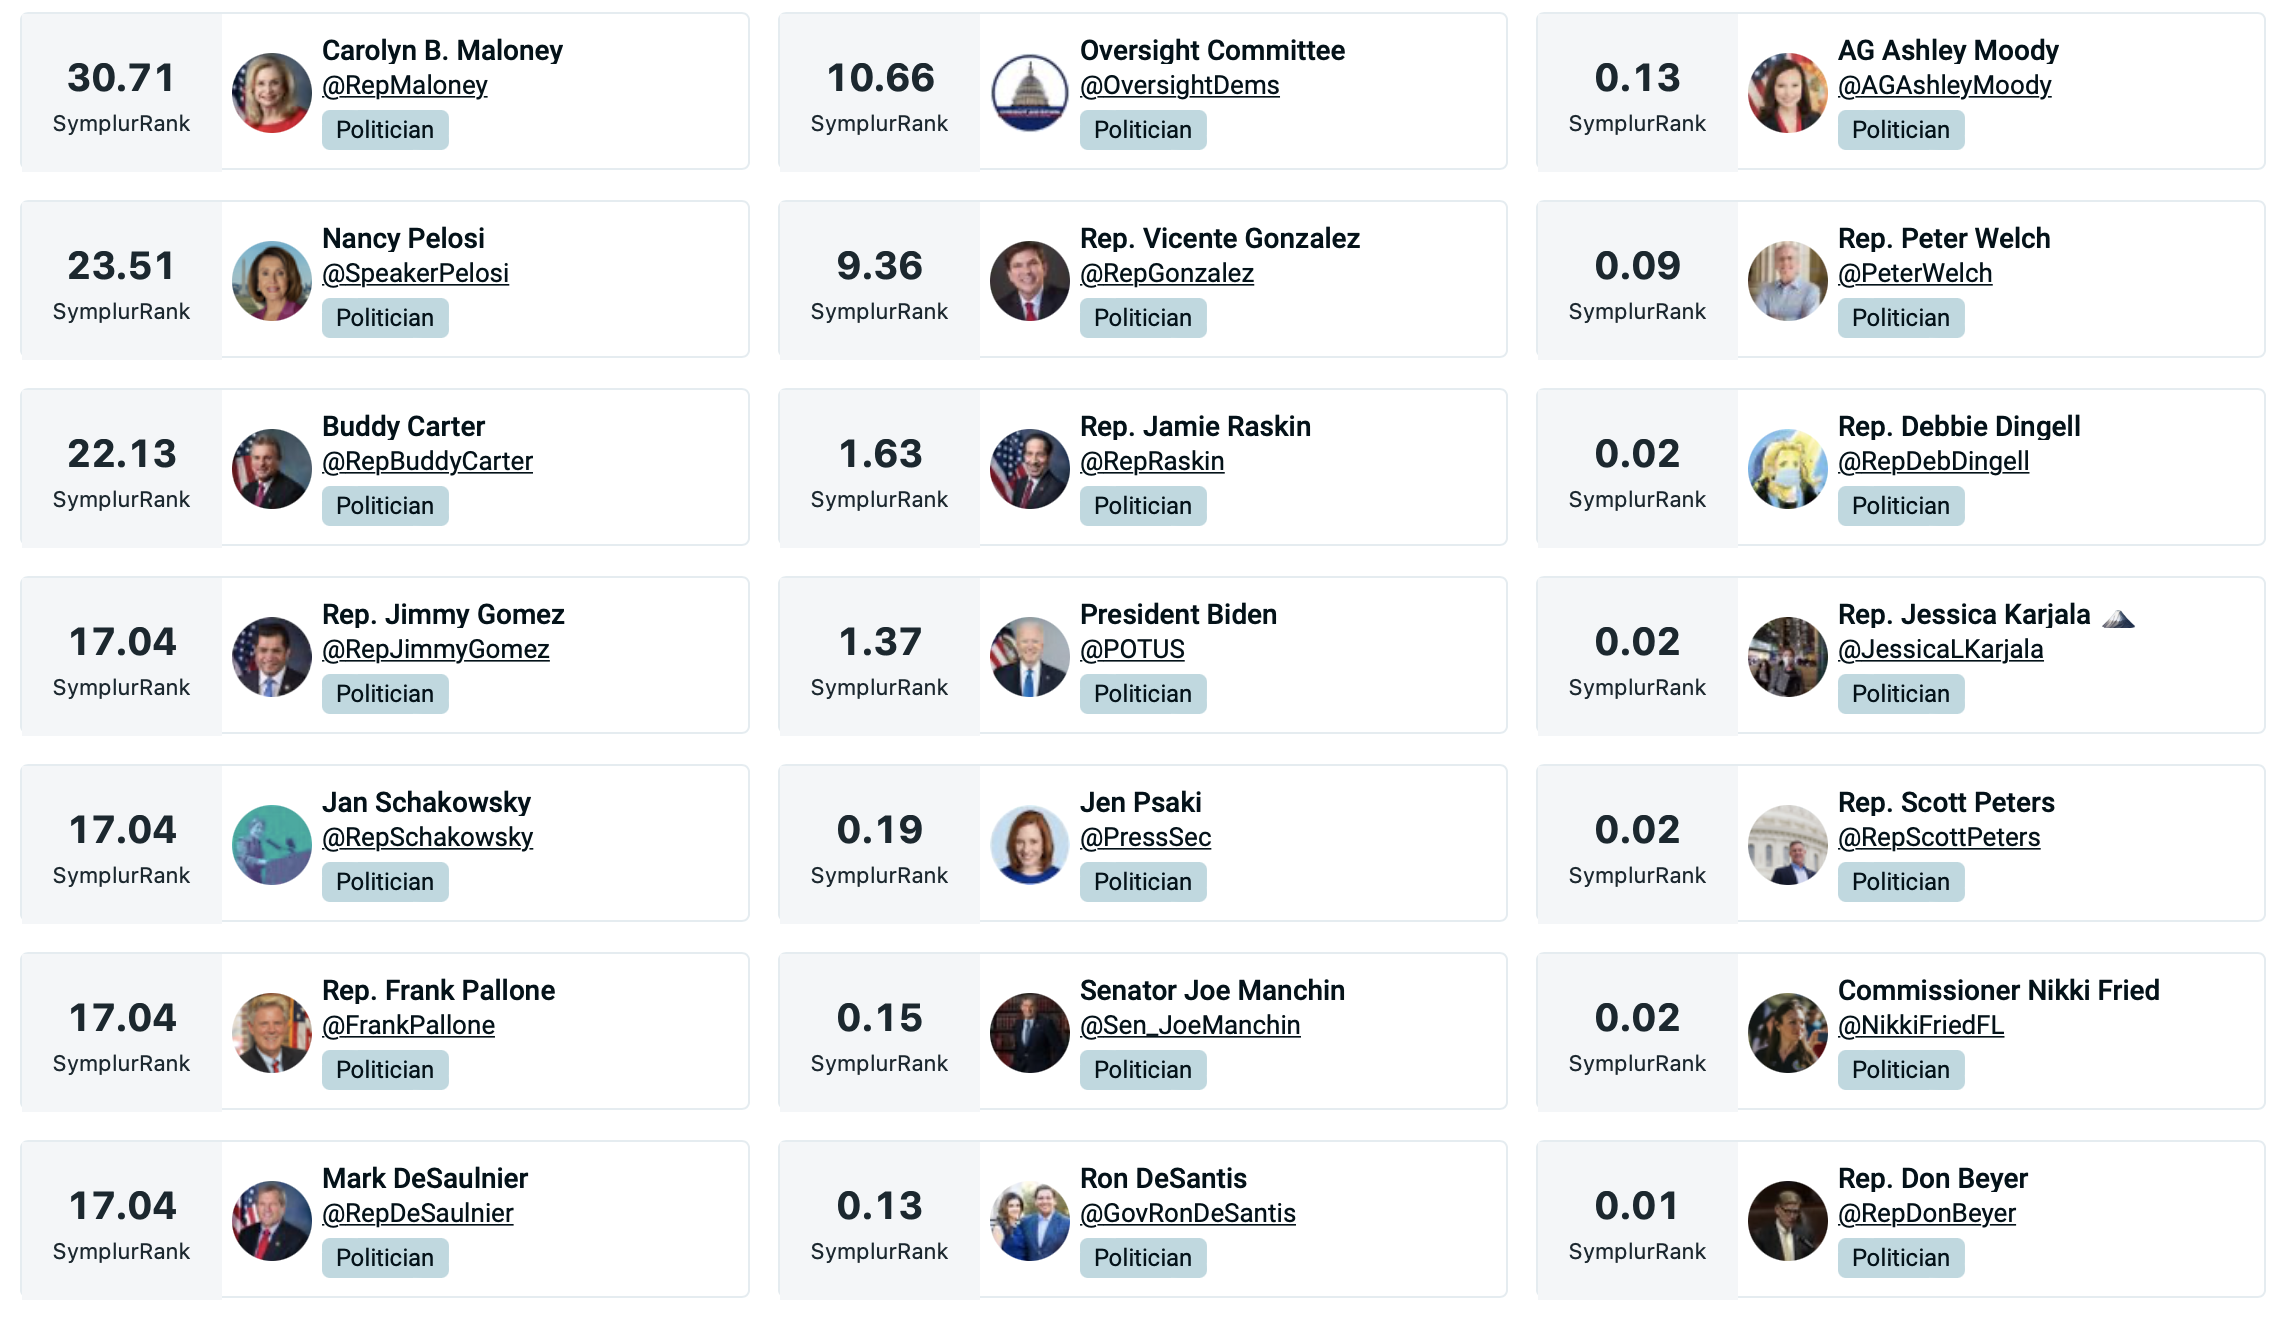
Politicians have weighed in on healthcare issues on social media at unprecedented levels these past two years. Paying attention to what they post on social media is now easier than … Continued
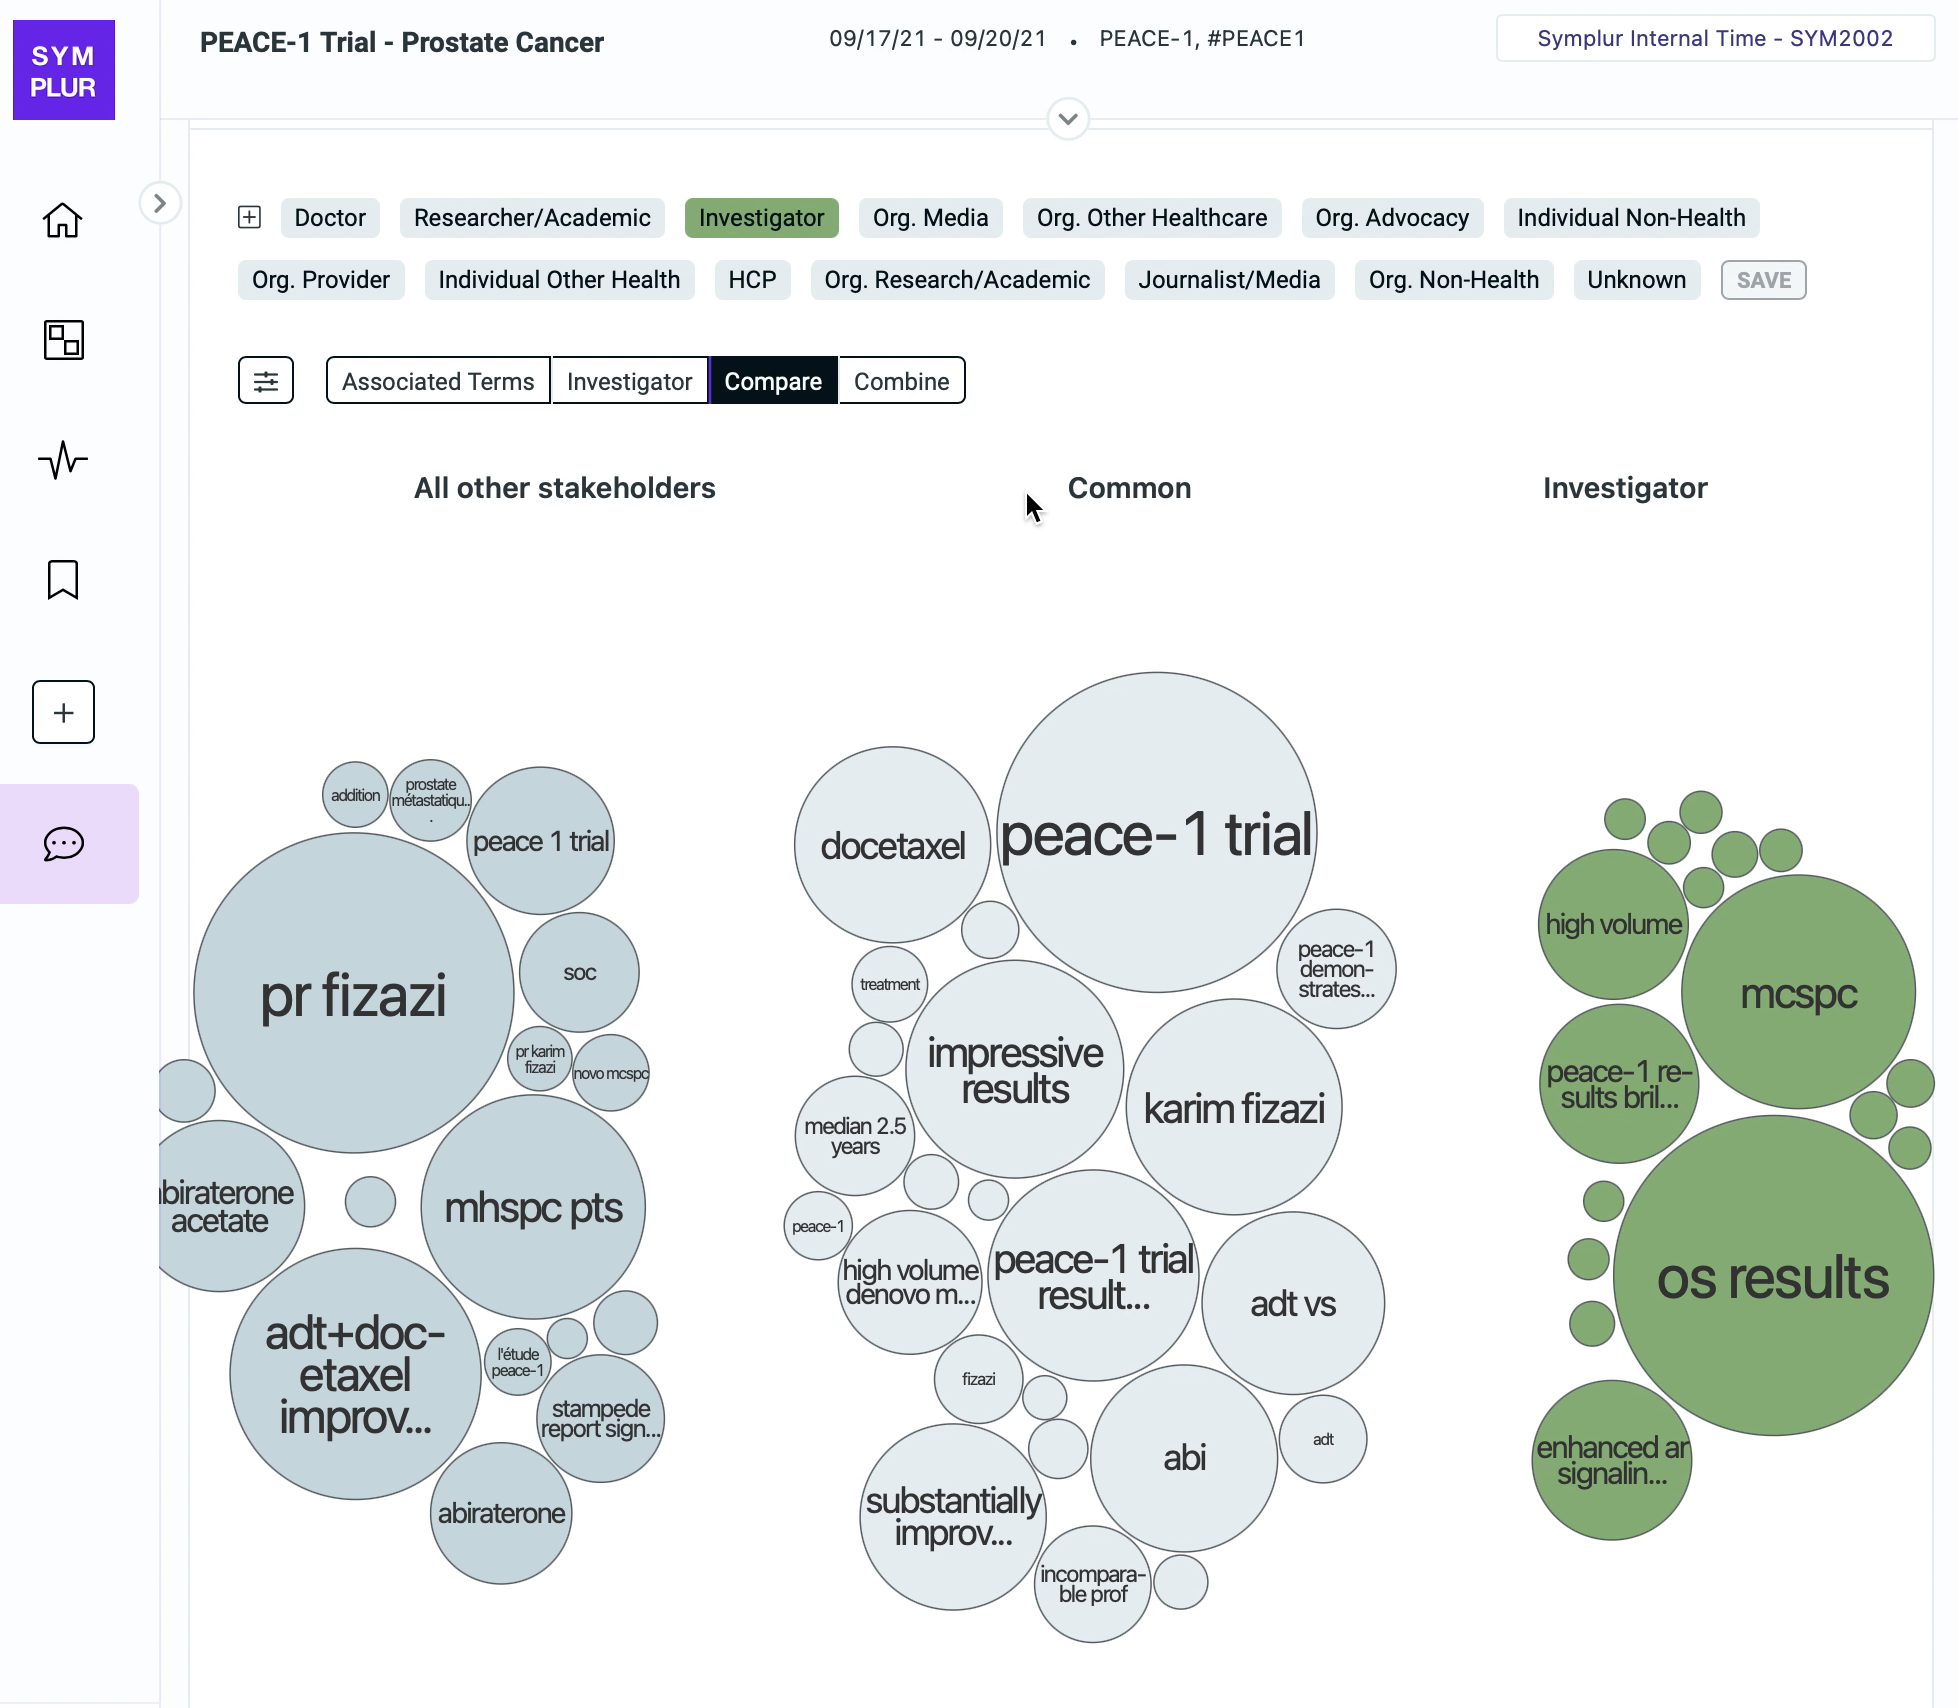
We owe so much to clinical trials and particularly to those who participate in them, the pandemic has made all of us intimately more aware of their value. At Symplur, we’re … Continued
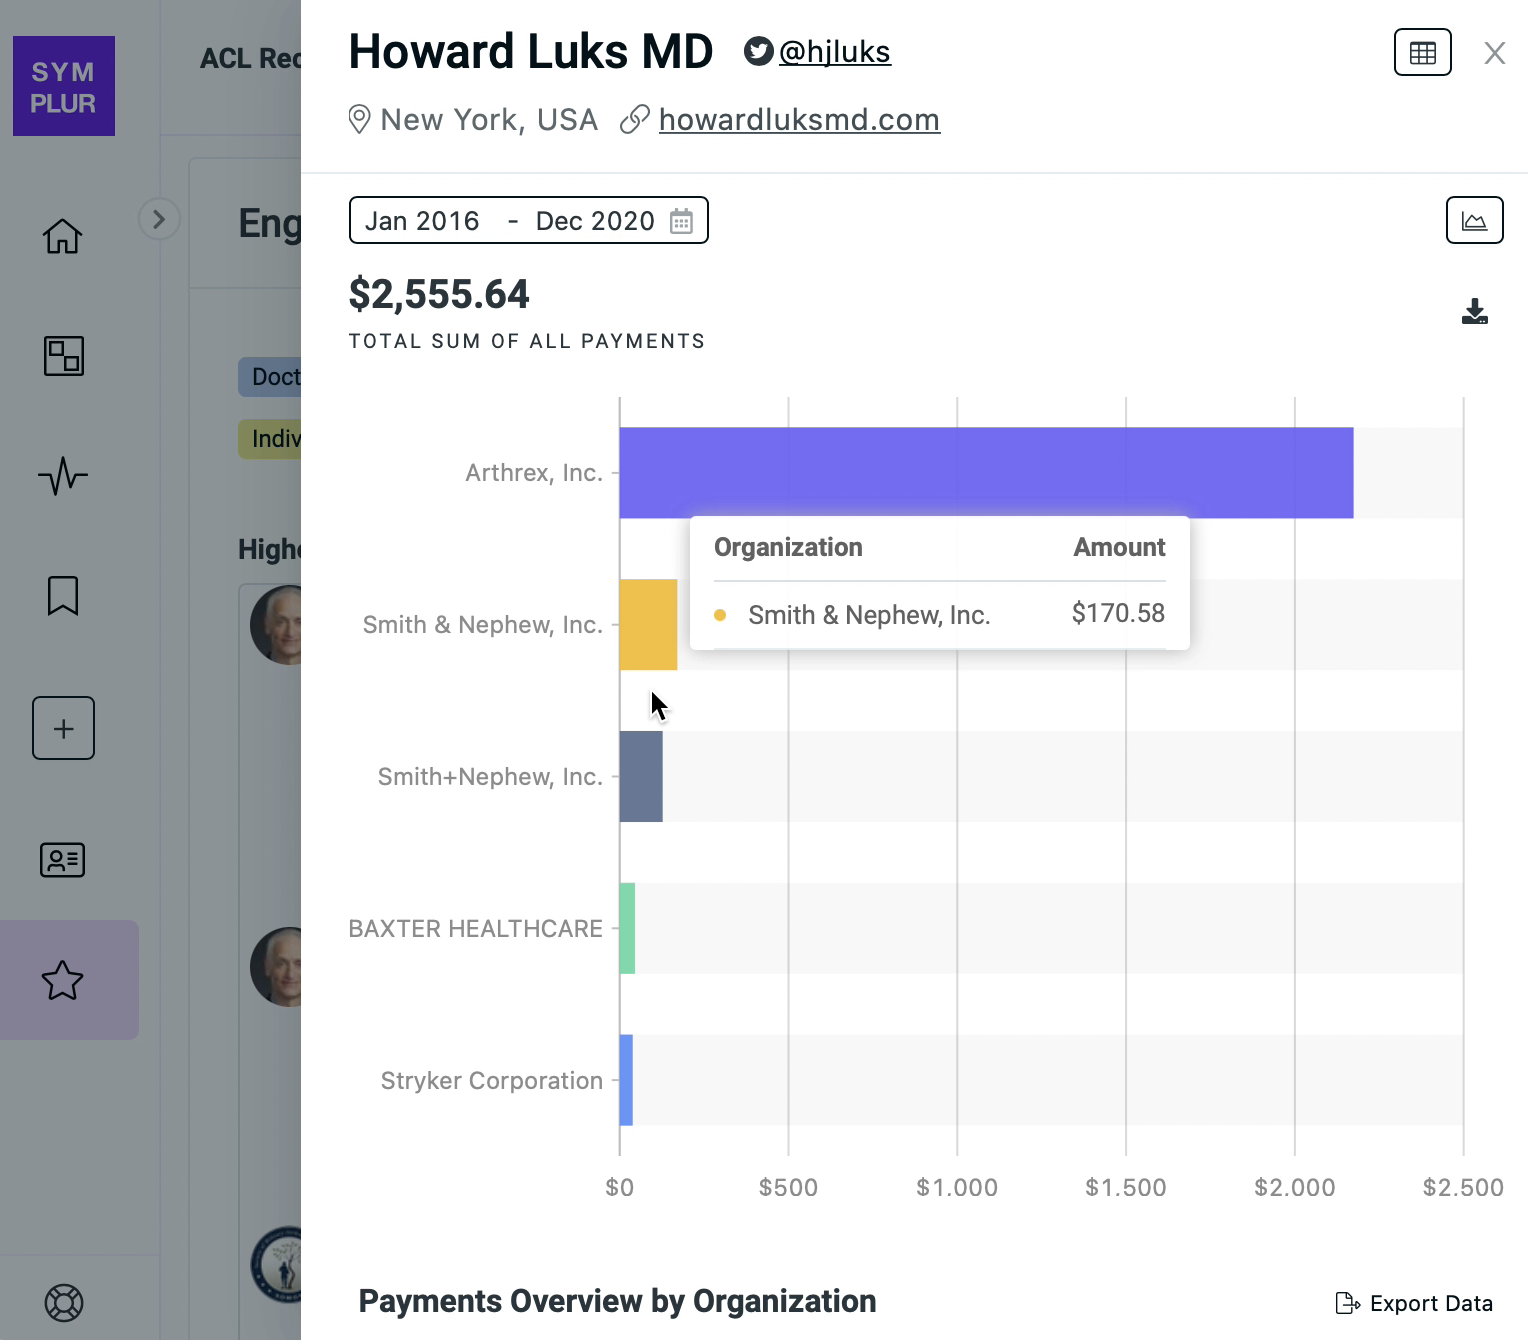
We’re delighted to bring transparency to healthcare social media with Open Payments data from CMS (also known as Sunshine Act data). This public dataset details payments made by drug and medical … Continued
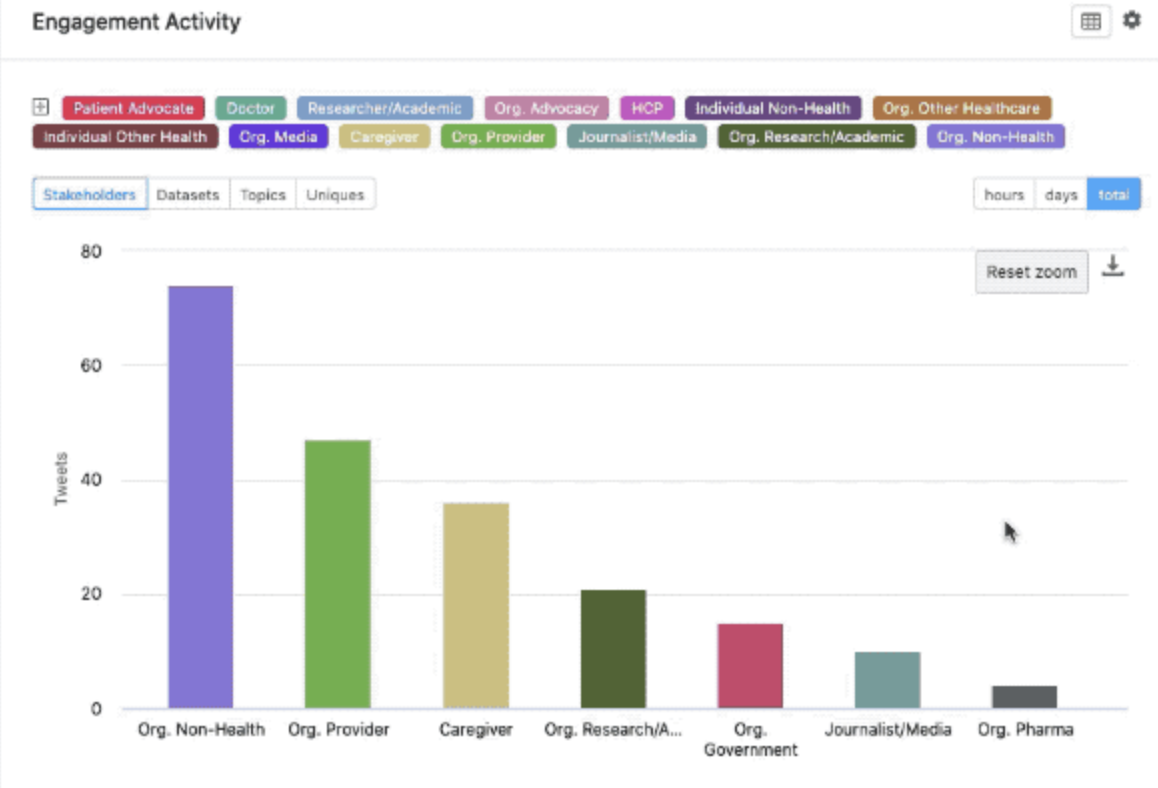
We have added two new features to the Engagement Activity that will improve your experience interacting with the data in this widget. Totals View The first feature is an option … Continued
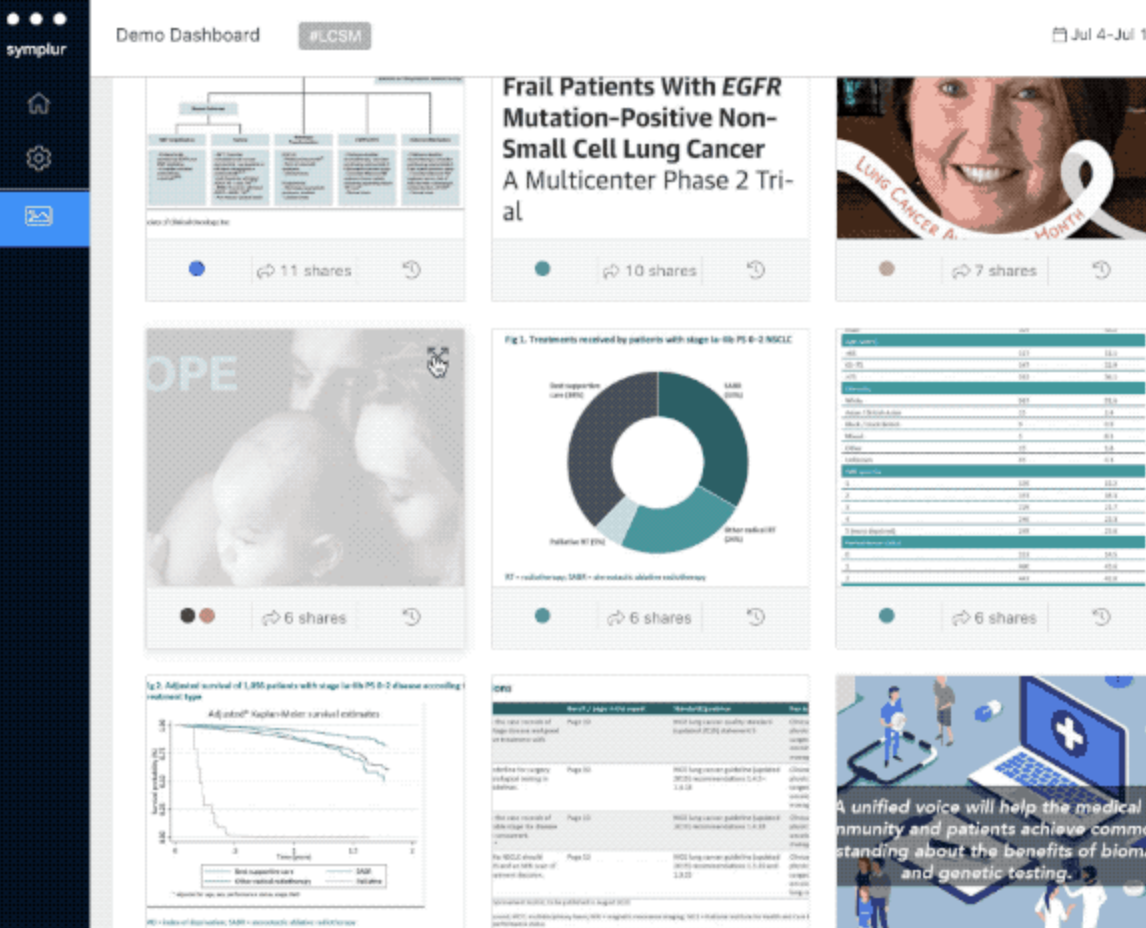
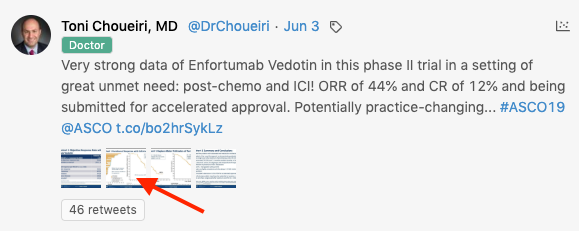
We just made full-screen gallery mode available in the Visuals widget so that you can now quickly and easily scroll through all the images. To access this view, click on … Continued
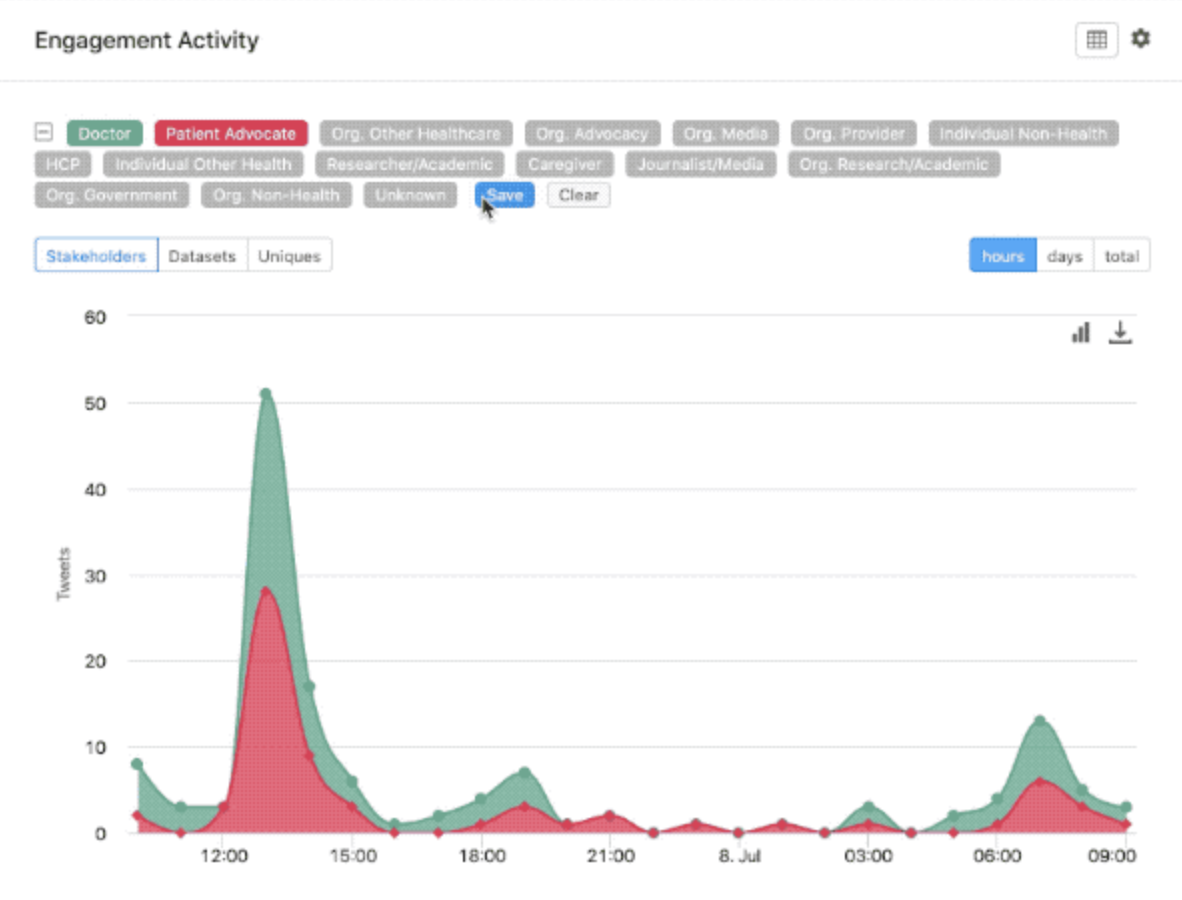
Many of our dashboard widgets have built-in healthcare stakeholder segment filters that provide you with the ability to isolate and view the data of your selected filters. Those selected filters … Continued
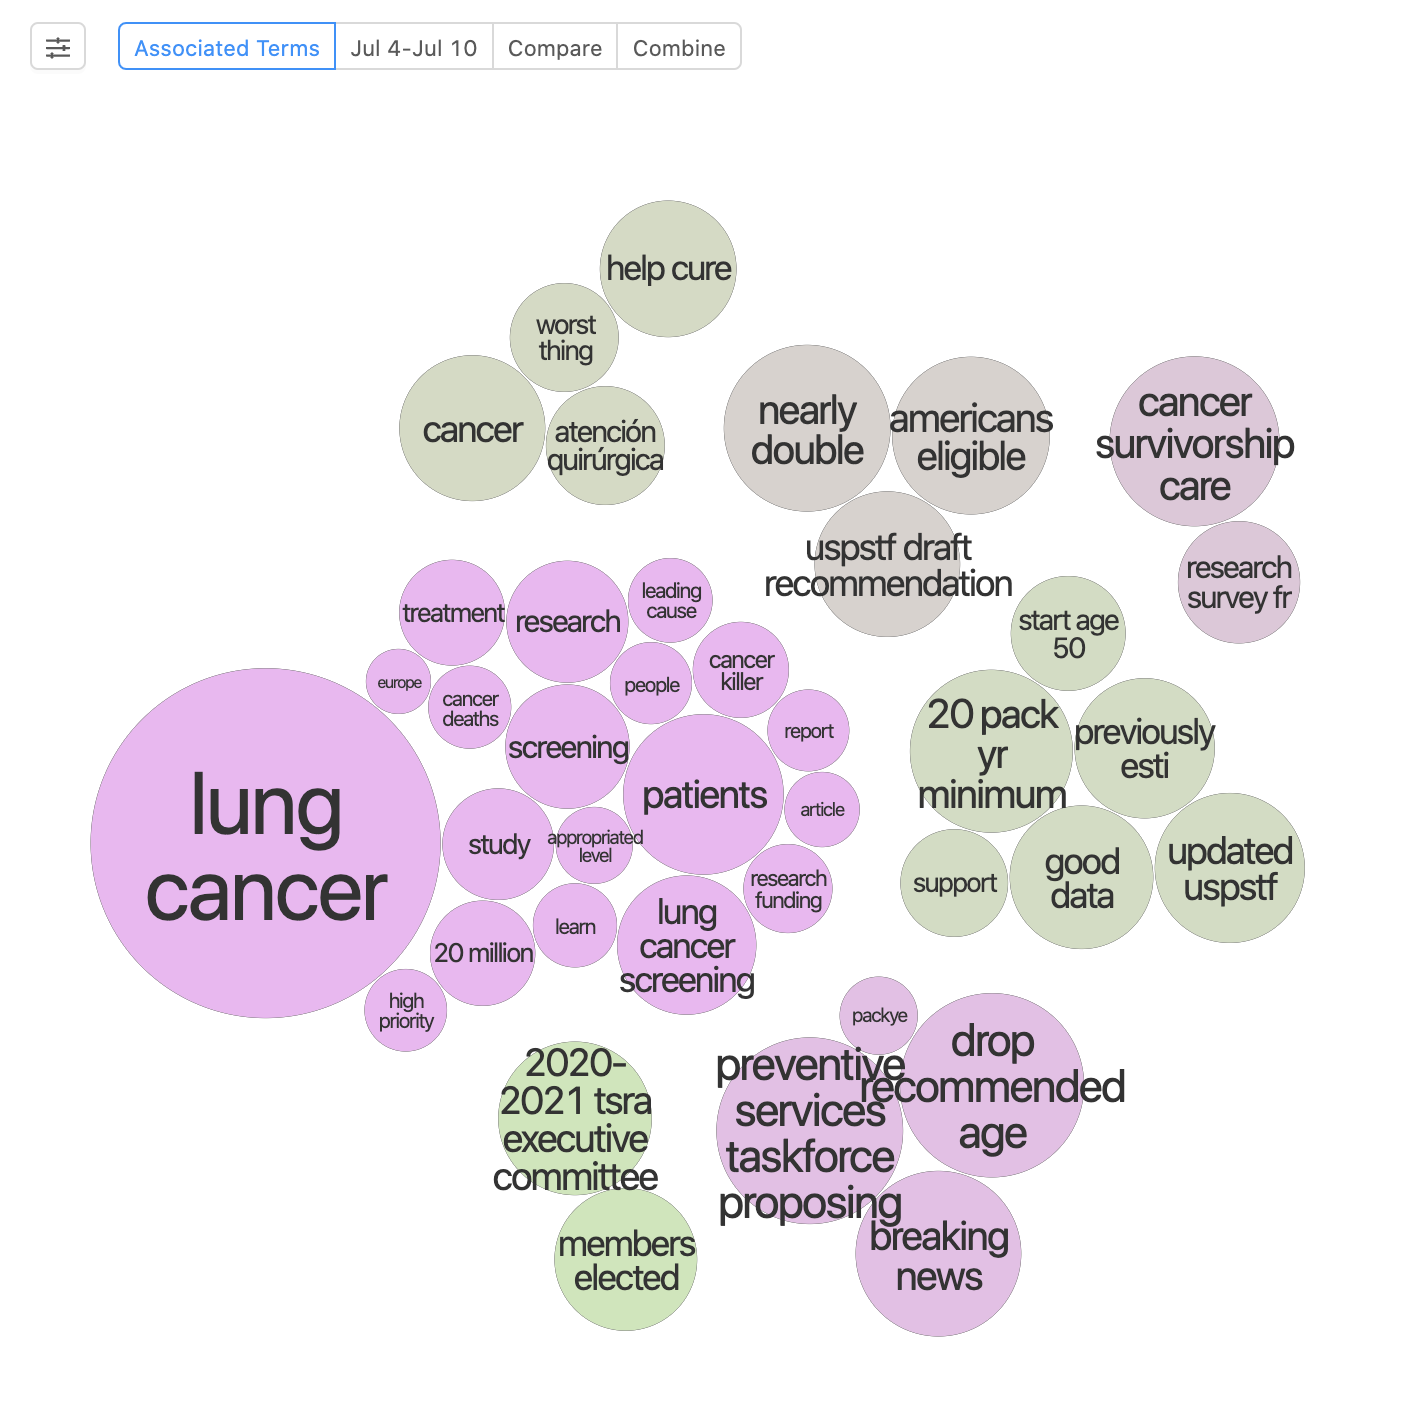
Trending Terms is a great tool that allows you to view the most used terms over a given period of time across your selected datasets. Now with our most recent … Continued
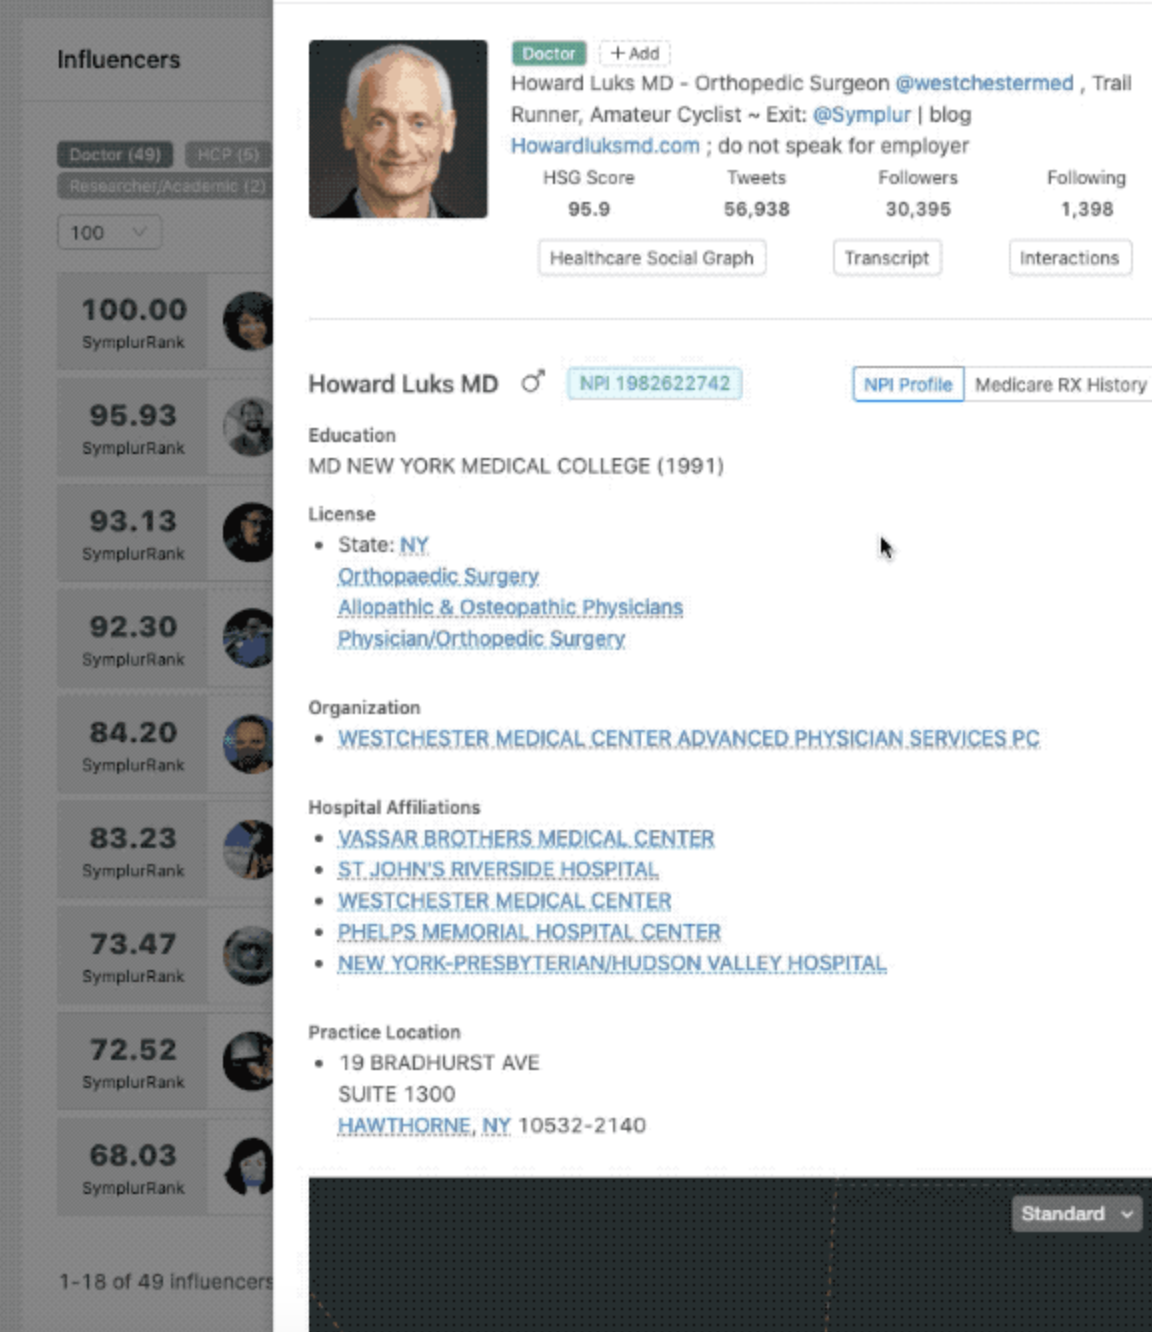
We have integrated the National Provider Identifier (NPI) data of doctors into our system and, as you see below, we have made it easily accessible in our dashboards. When you … Continued
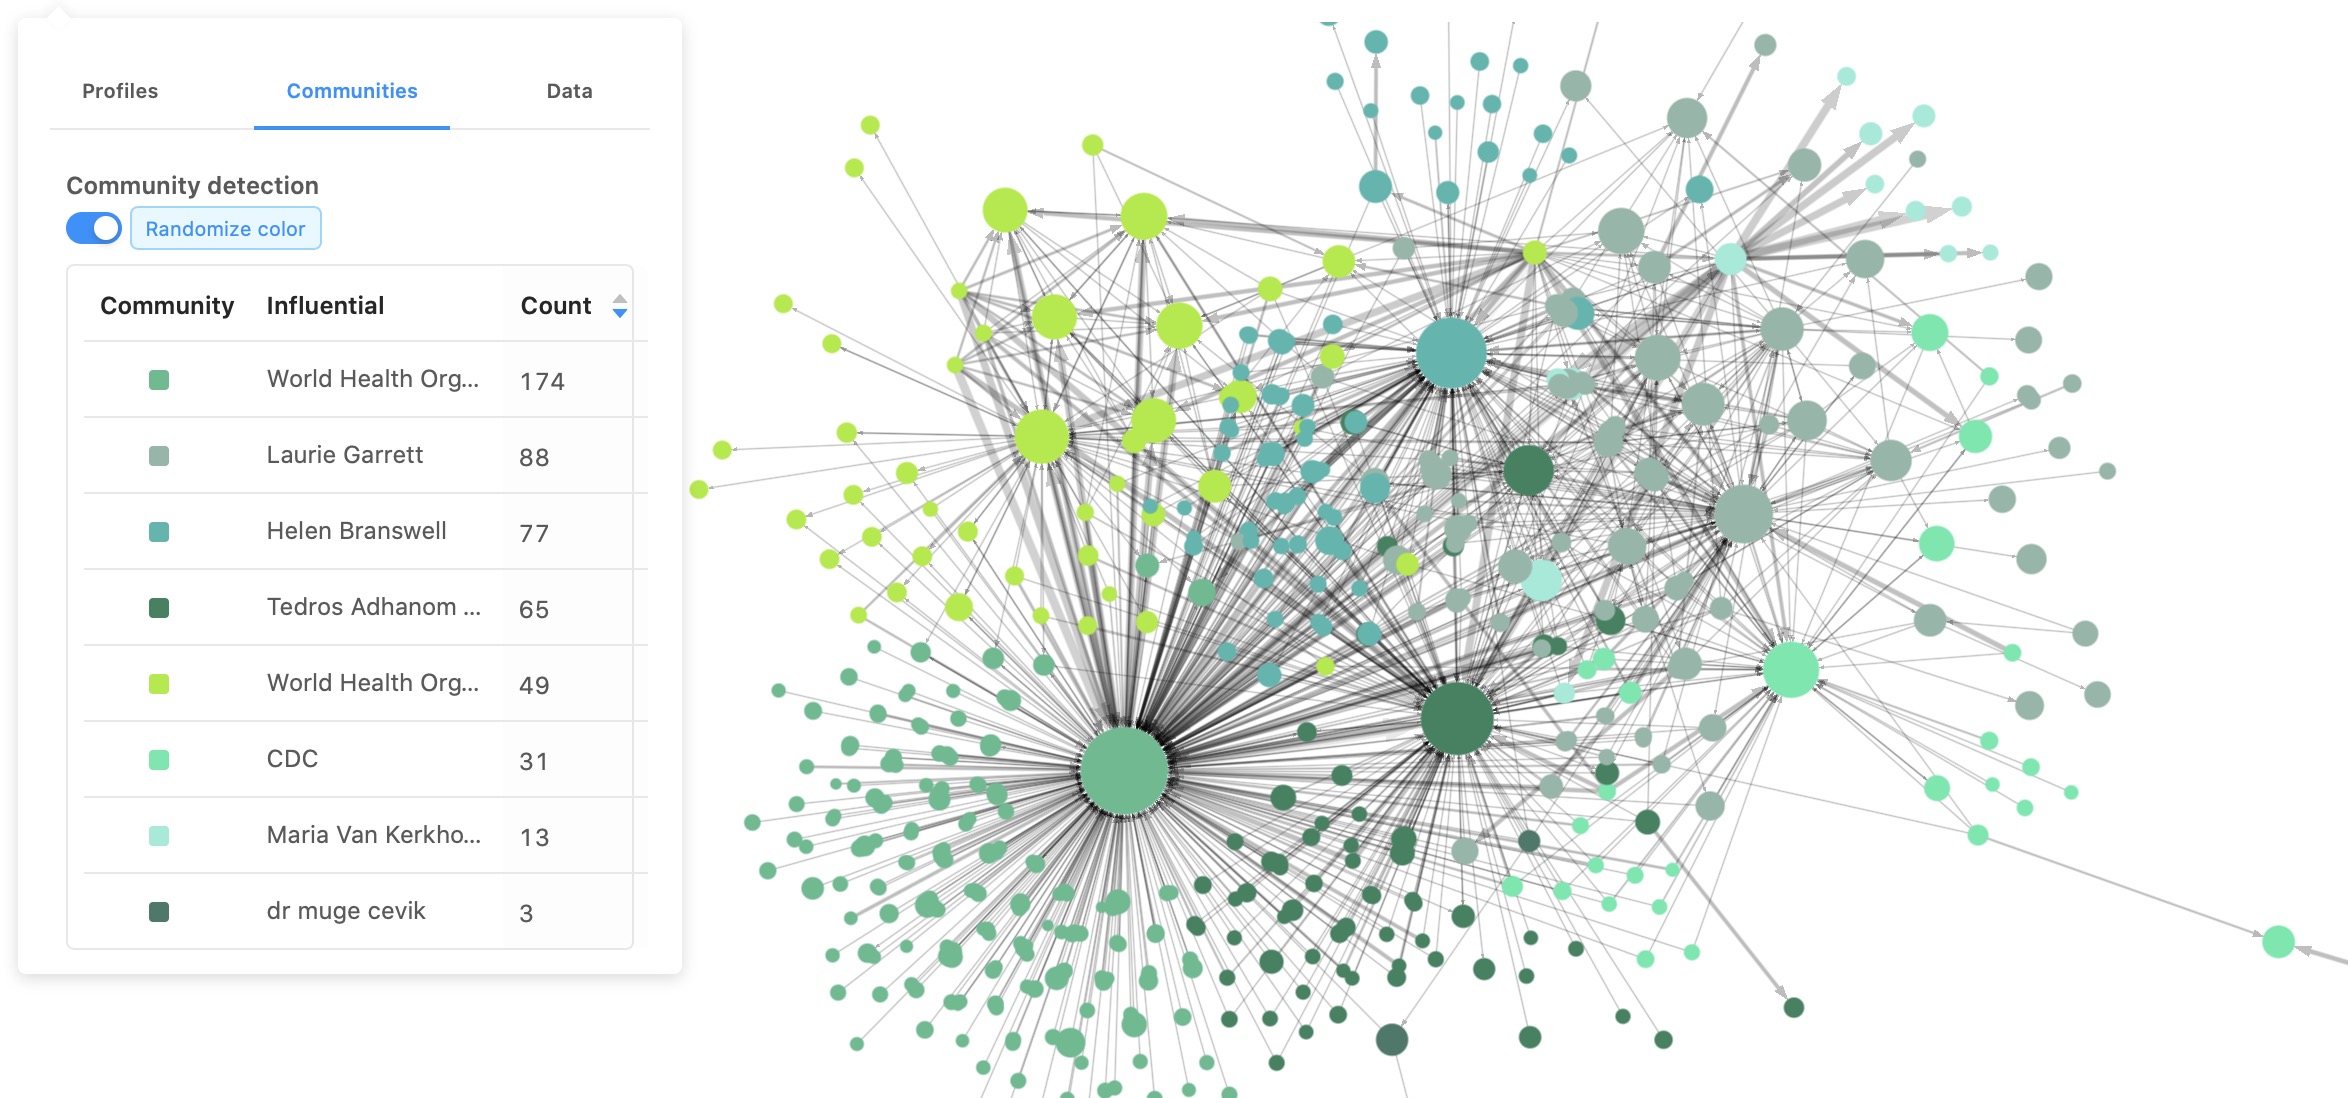
With the latest Network Analysis Advancements, we added many new UI controls that allows for a deeper understanding of a community. We have added another great feature — Community detection. … Continued
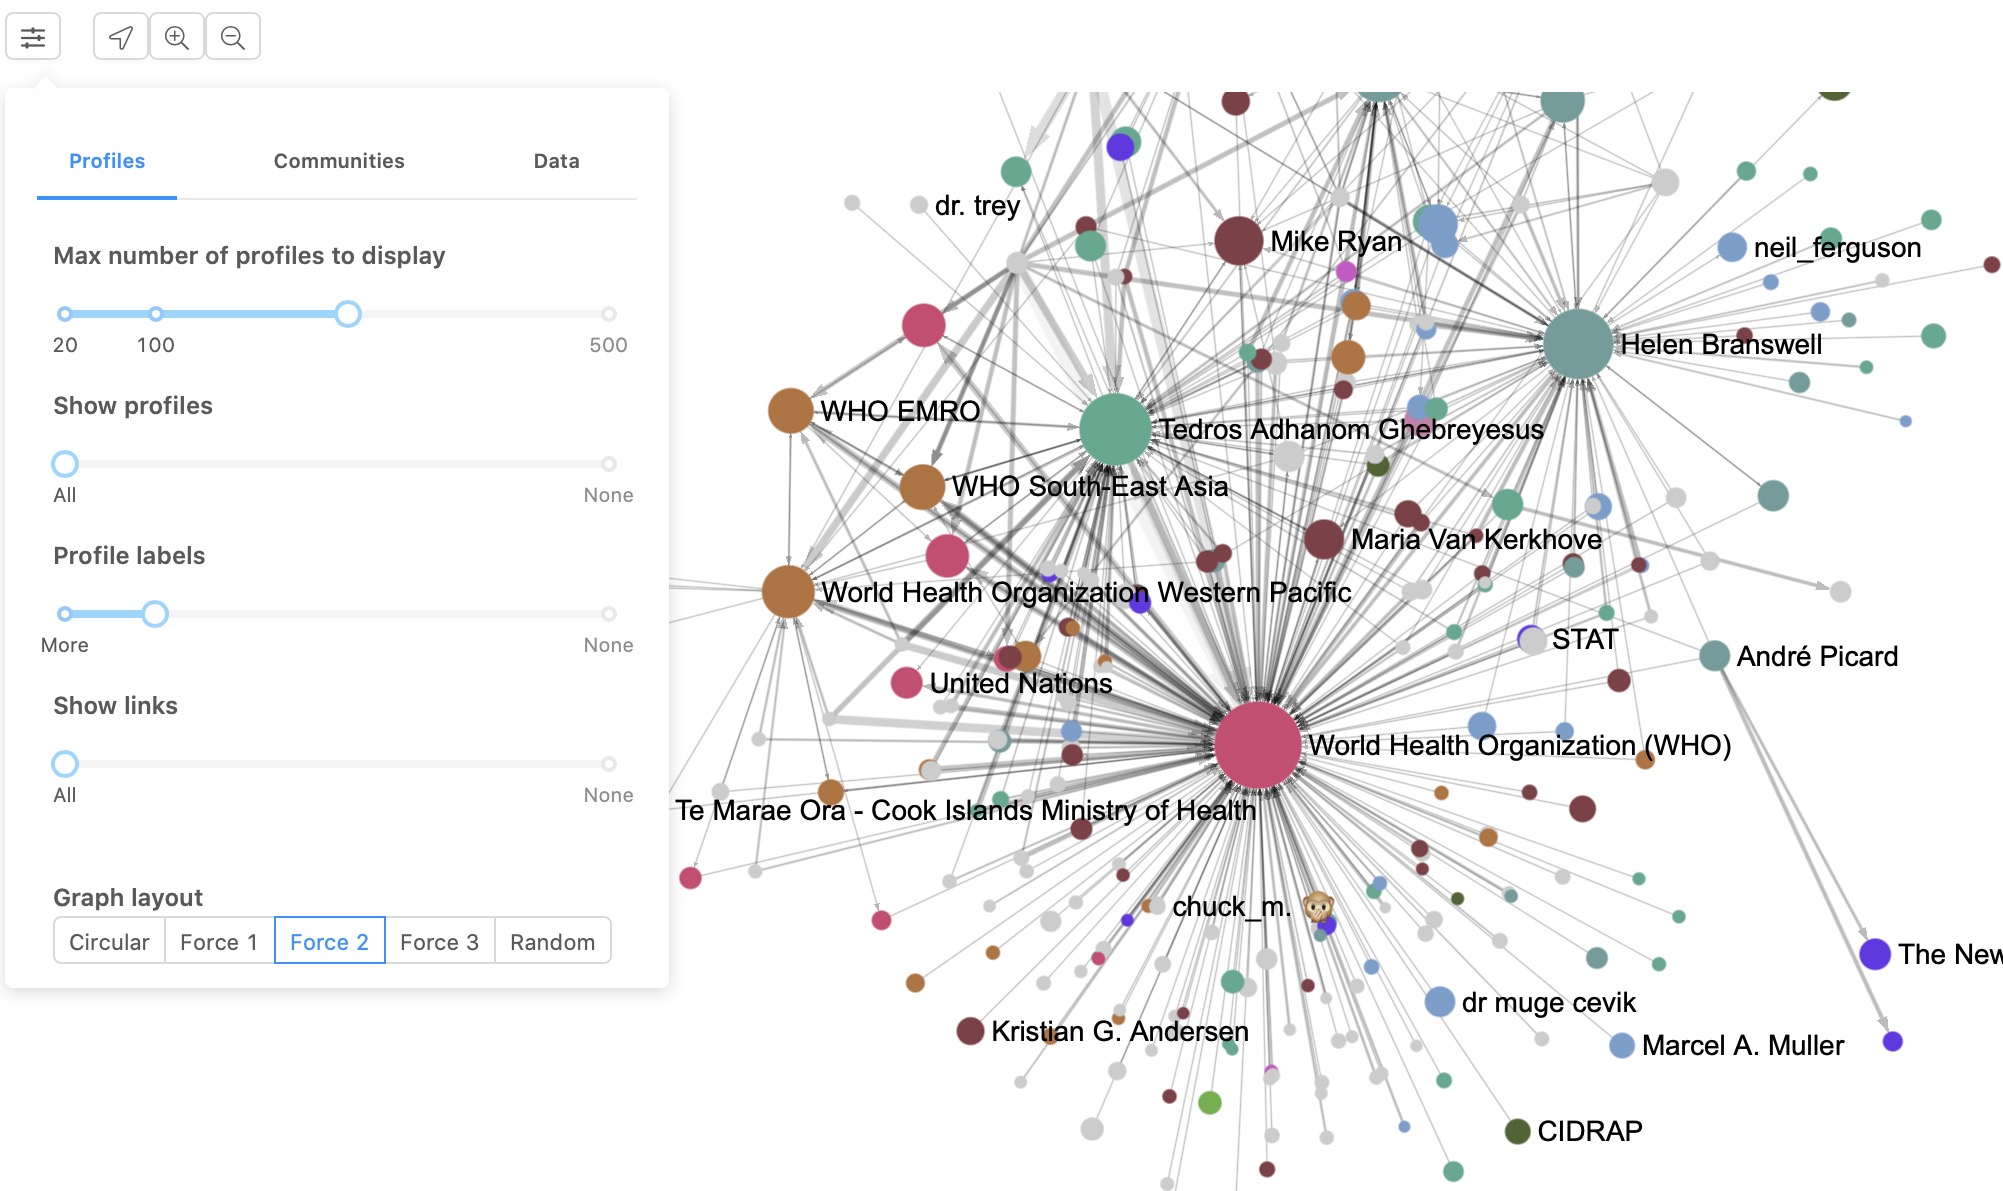
The Network Analysis widget has been upgraded with new features, including Community Detection functionality, and a new user interface for network graph settings. New Button: Network Analysis Settings We have … Continued
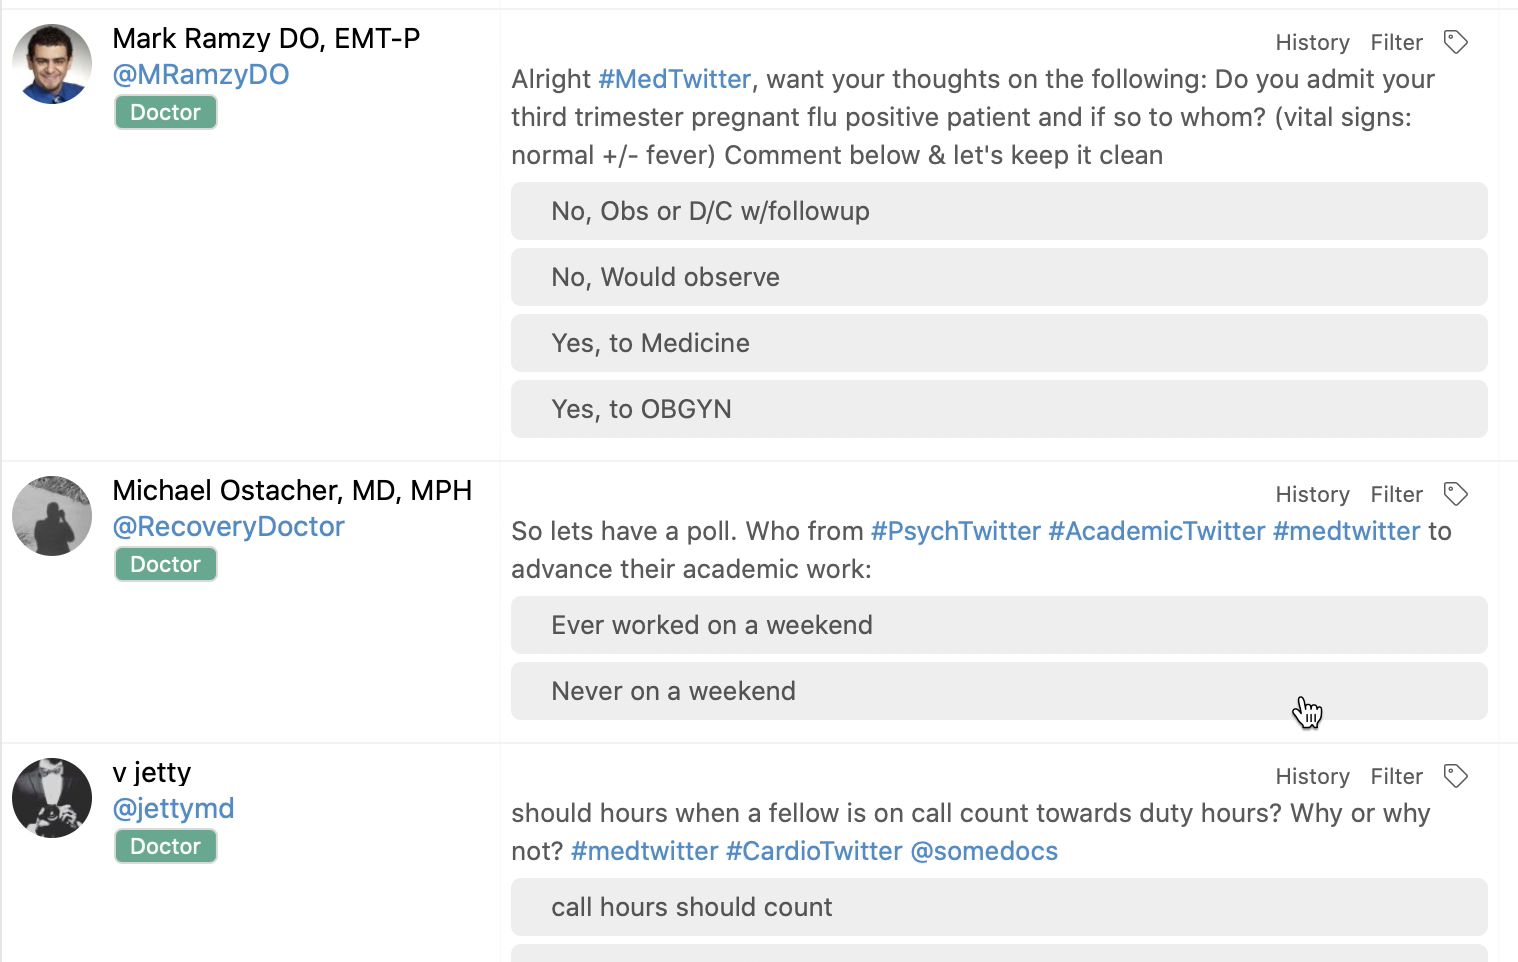
Tweets with polls is a darling in the world of healthcare social media. We see huge use of them especially among physicians and #MedTwitter. We’re now enabling deeper analysis of … Continued
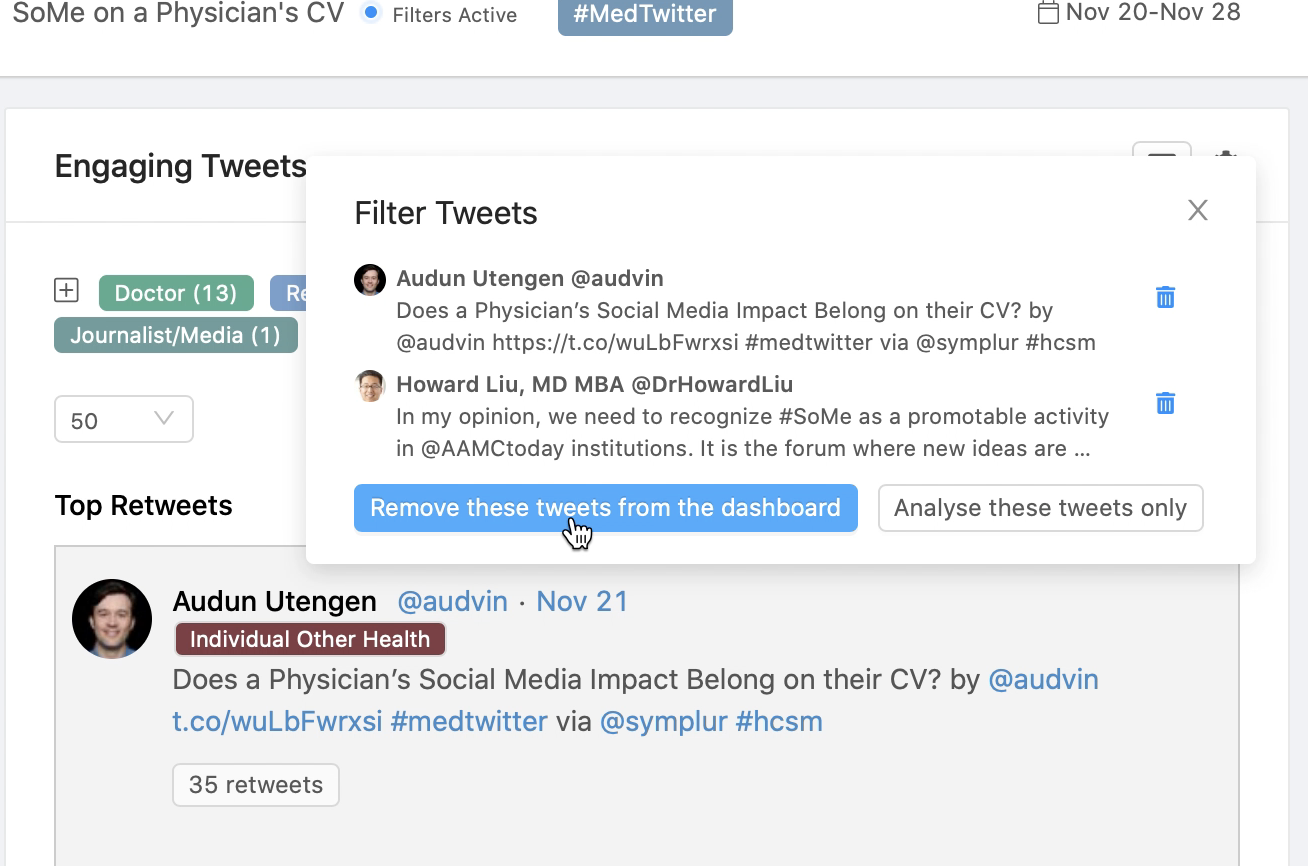
Once in a blue moon you may find a tweet from some celebrity or spammer that creates a lot of noise in an otherwise quality healthcare conversation. We now have … Continued
Many of our Symplur Signals customers are teams from Medical Affairs, Scientific Communications, or Academic Research. These teams work with published research on a daily basis and our engineers have … Continued
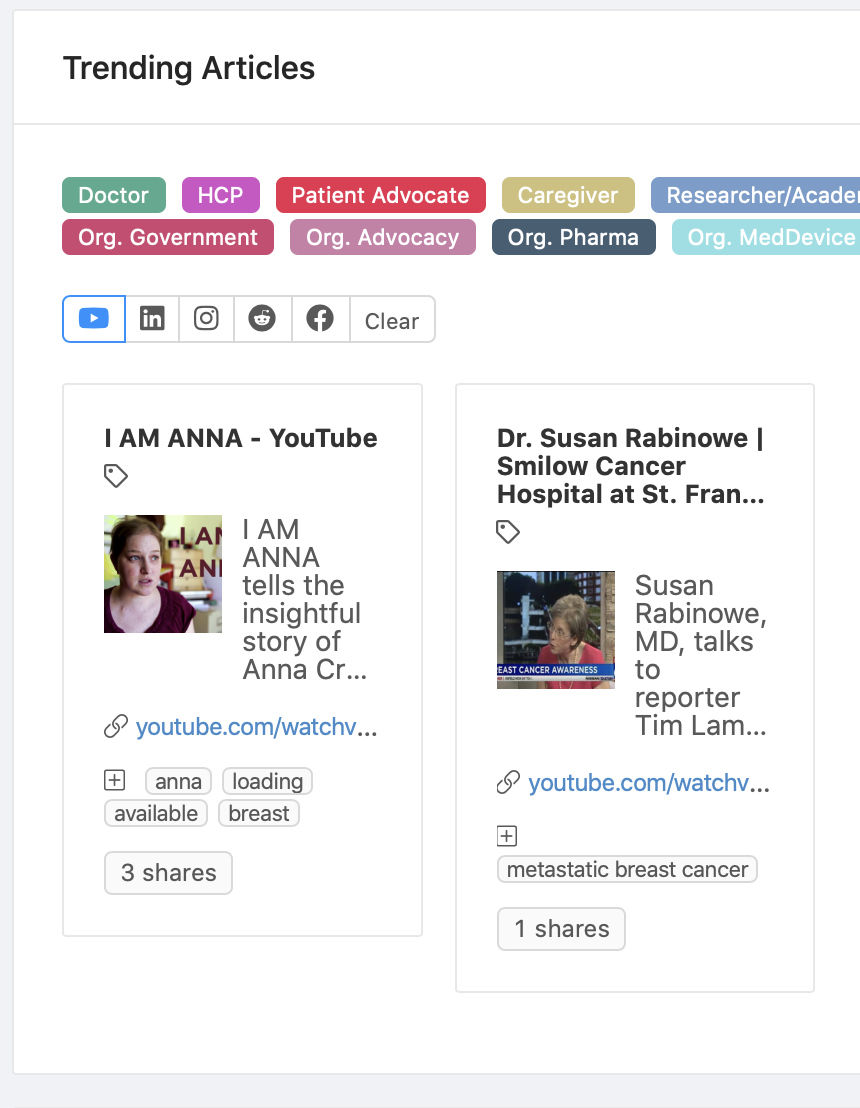
You can now easily apply a social network filter to the Trending Articles to view articles by the selected social media source. Current available social network filters are for Youtube, … Continued
To randomize the tweets in the Tweet Transcript widget toggle the “Random” switch to the “on” position. Click on the “Refresh” to return a new set of random tweets in … Continued
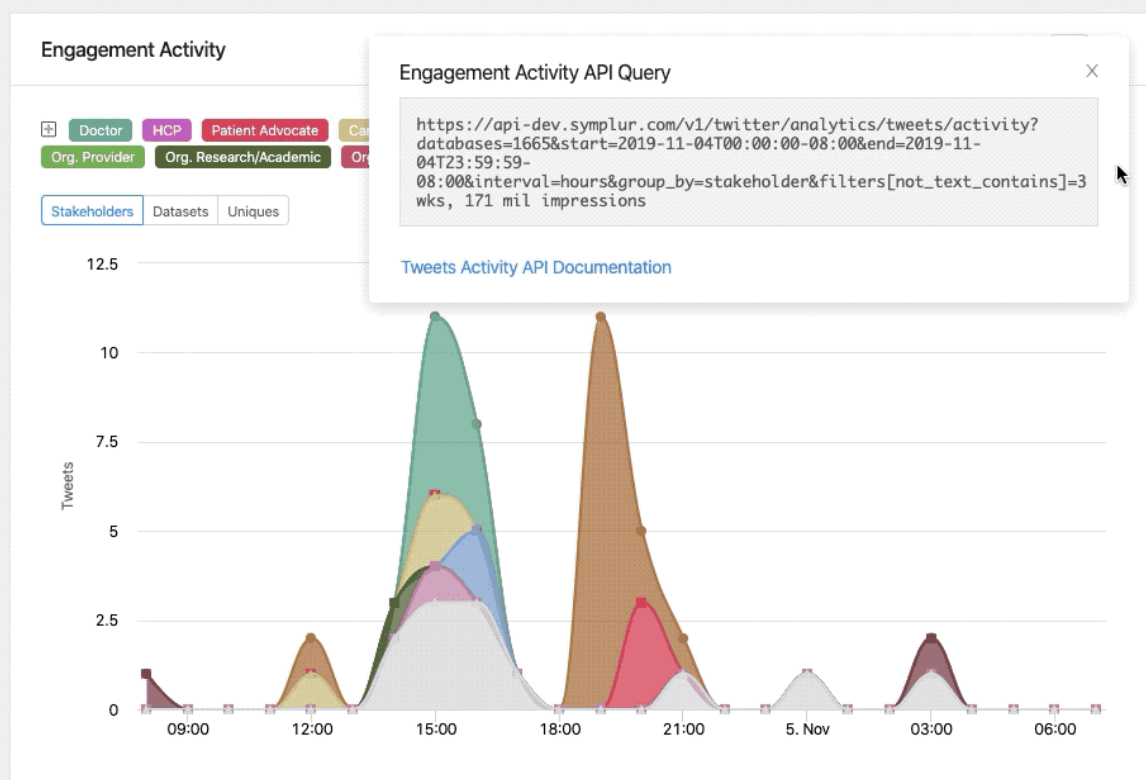
For every widget in the dashboard, Enterprise customers now have access to the actual API request used for pulling in the data for the widget. By clicking on “API Query” … Continued
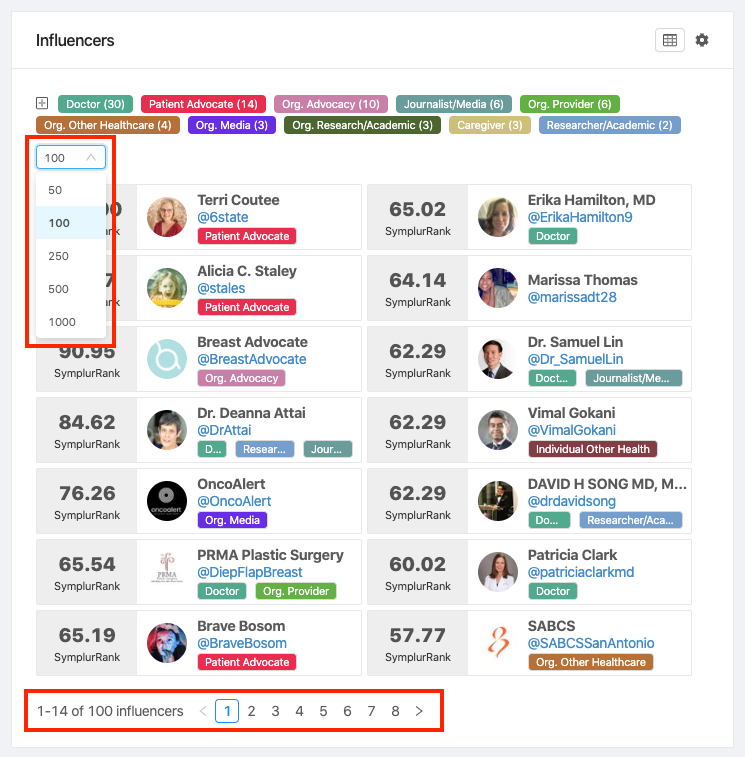
The Influencers widget has been updated with the following: Influencers list order change. The influencers are now ordered from top to bottom instead of left to right. New dropdown to … Continued
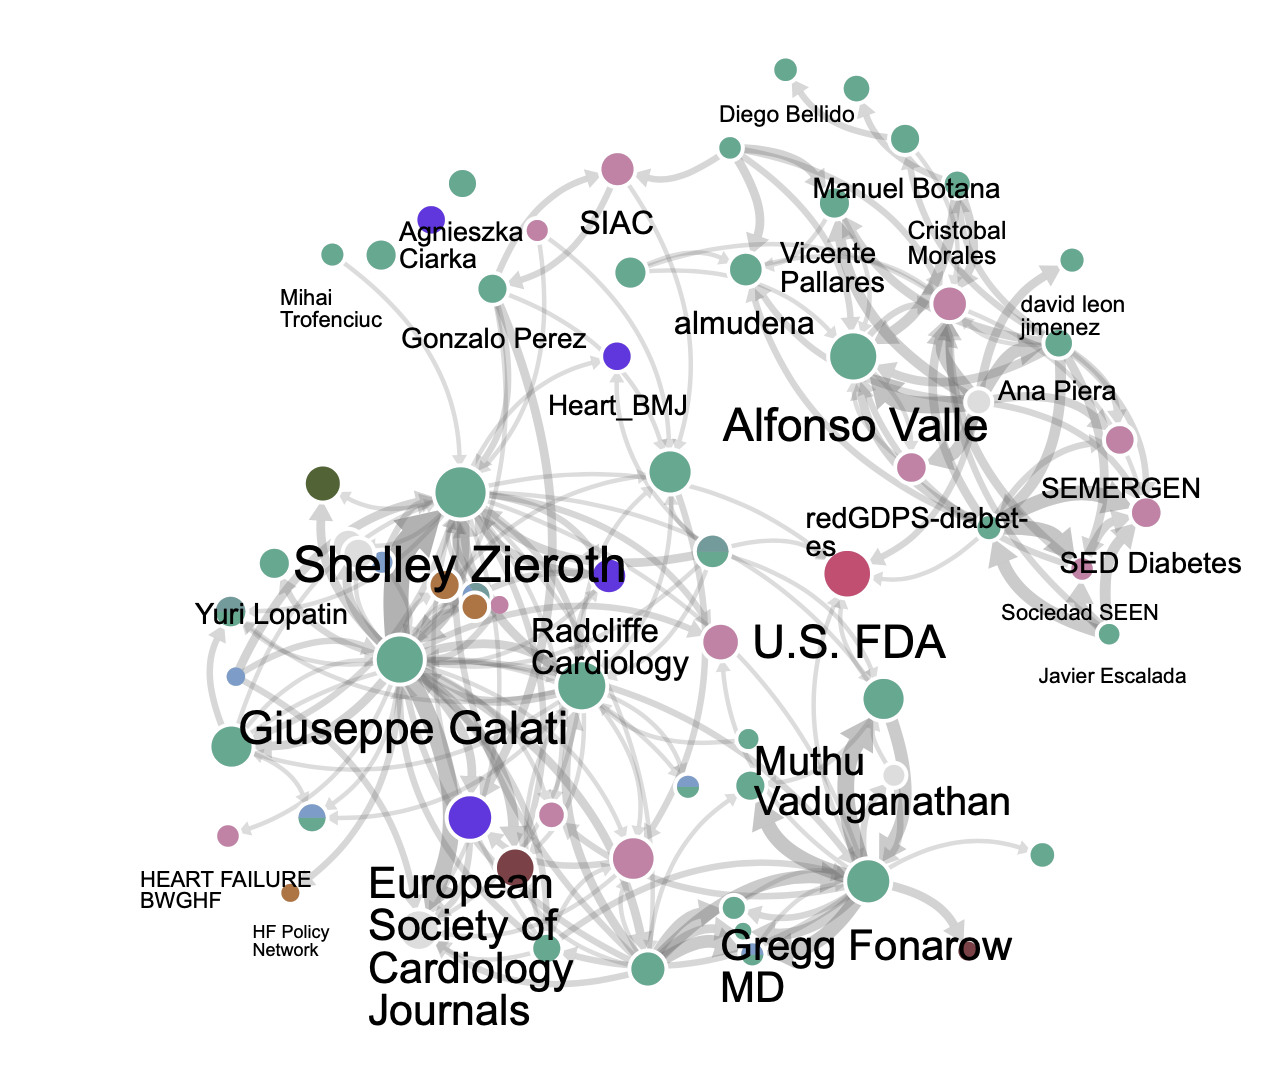
In our continual efforts to improve our results and deliver relevant data, we have made the following updates to the Network Analysis: Rank by “SymplurRank” is used by default to … Continued
Tweet Transcript is a new feature for the Trending Terms widget accessible when you click one of the term bubbles. The dashboard app will load all the tweets and retweets … Continued
The Network Analysis graph has been updated with brand new options that affect the generation of the network chart based on the combination of the options selected. The first set … Continued
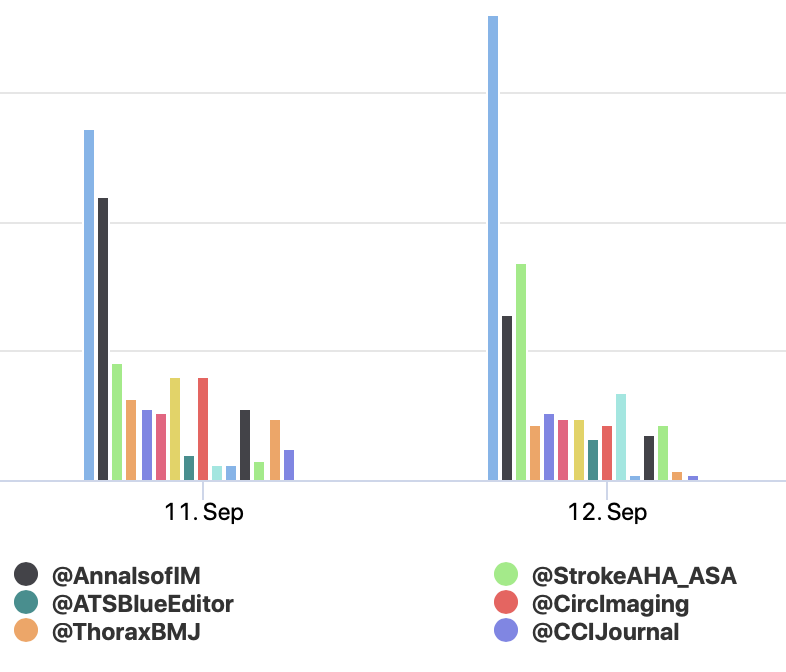
The following new chart types are now available for the Engagement Activity chart: Area (Stacked or Non-Stacked) Area Spline (Stacked or Non-Stacked) Column (Stacked or Non-Stacked) Line (Stacked or Non-Stacked) … Continued
The dashboard has been updated to display “Quote Tweets” when it is present. They are displayed directly underneath the tweet, just like in Twitter. Also available now is the ability … Continued
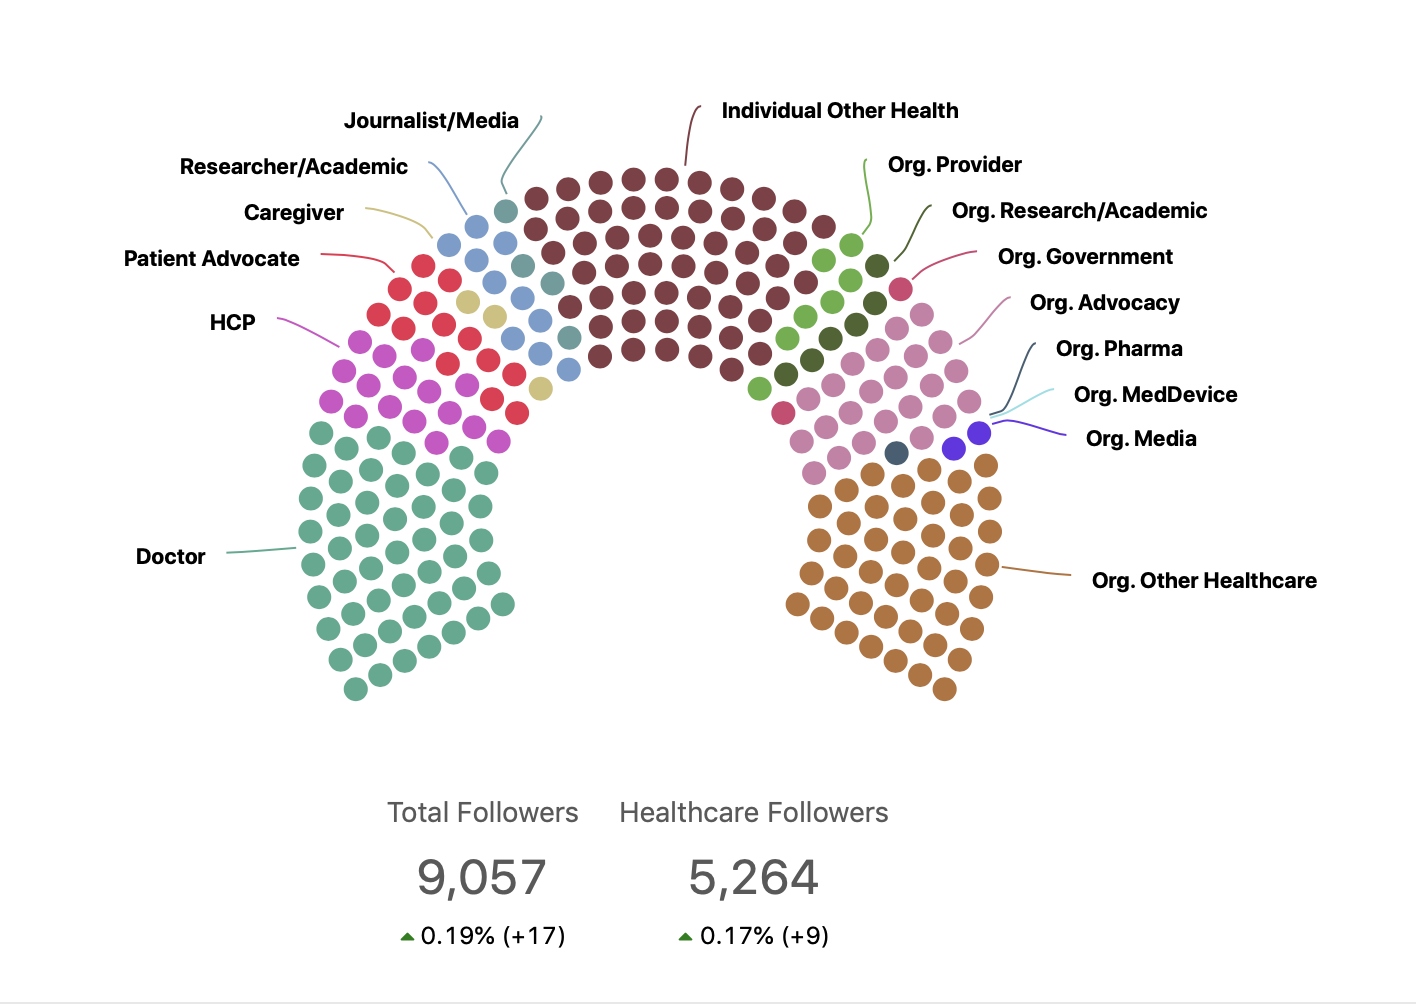
We have updated the Follower Audience widget to include the generation of a new ‘audience graph.’ This new graph is an optimal way to view the composition of the followers … Continued
We are very excited to announce the release of three major updates to the Sentiment Analysis widget. The Sentiment Algorithm The first update is entirely “under-the-hood” — the overhaul of … Continued
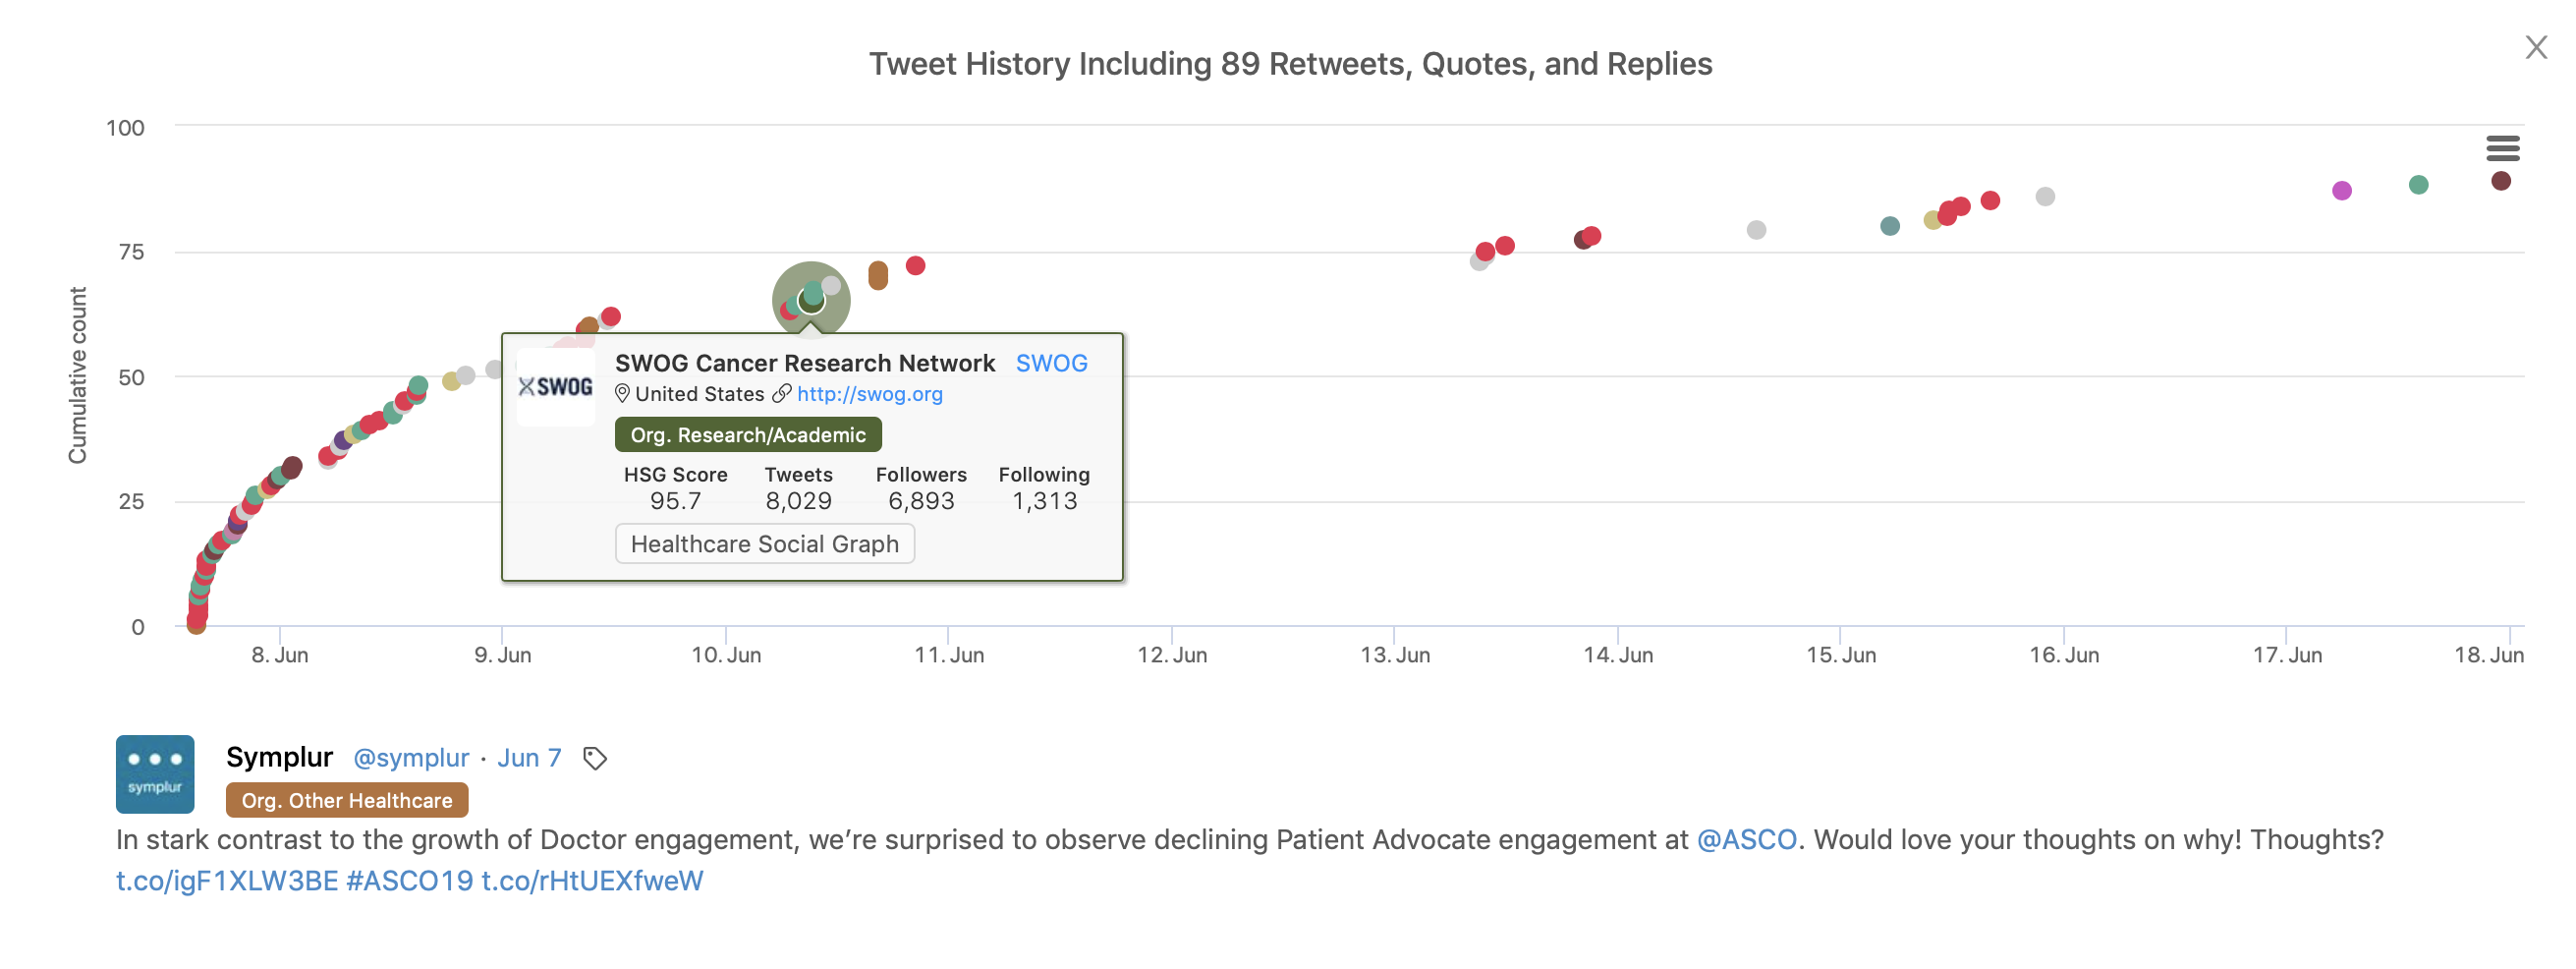
Tweet History is a new data graph that is available now for Enterprise clients. This new data graph allows you to view the retweets, quotes, and replies of a particular … Continued
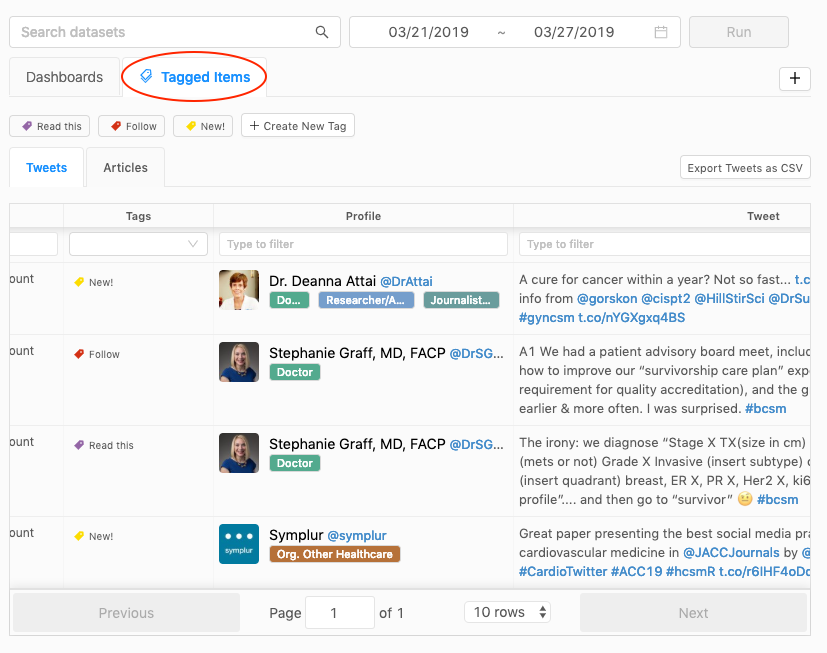
Available now to our Enterprise customers, a new feature has been released to add your own custom tag or tags to any tweet or article in the dashboard. To tag … Continued
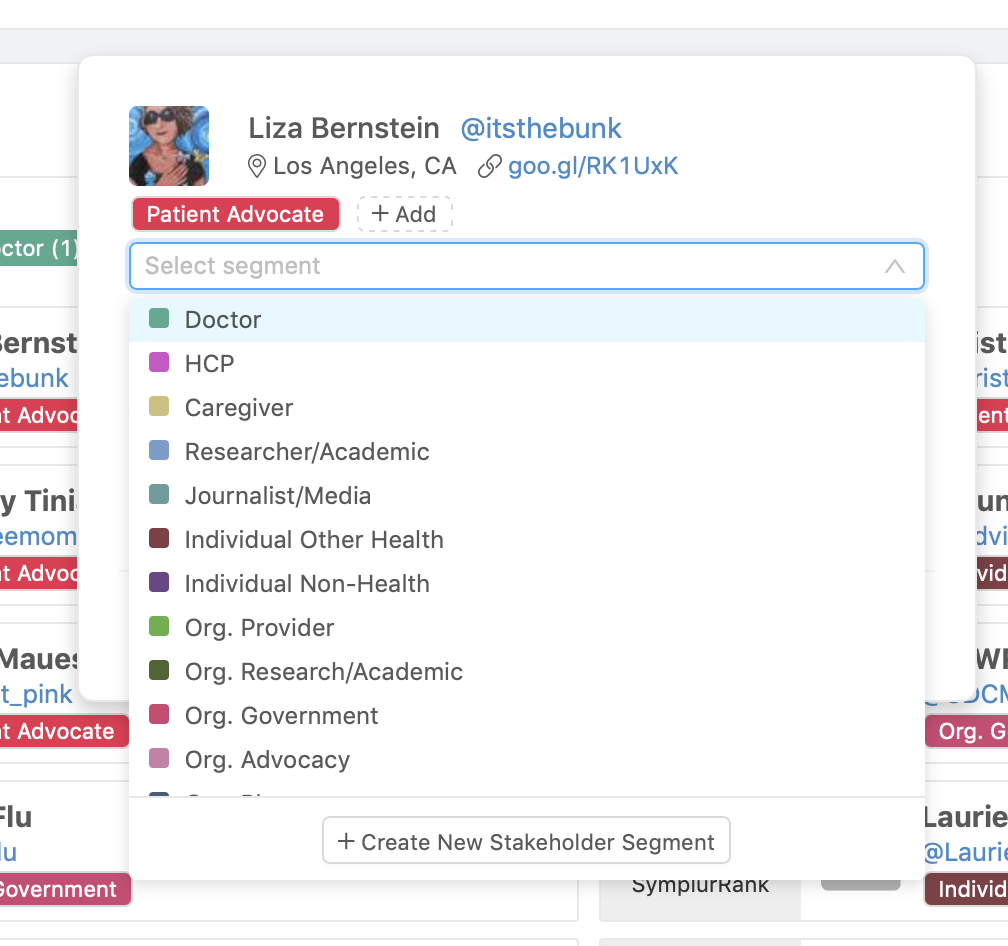
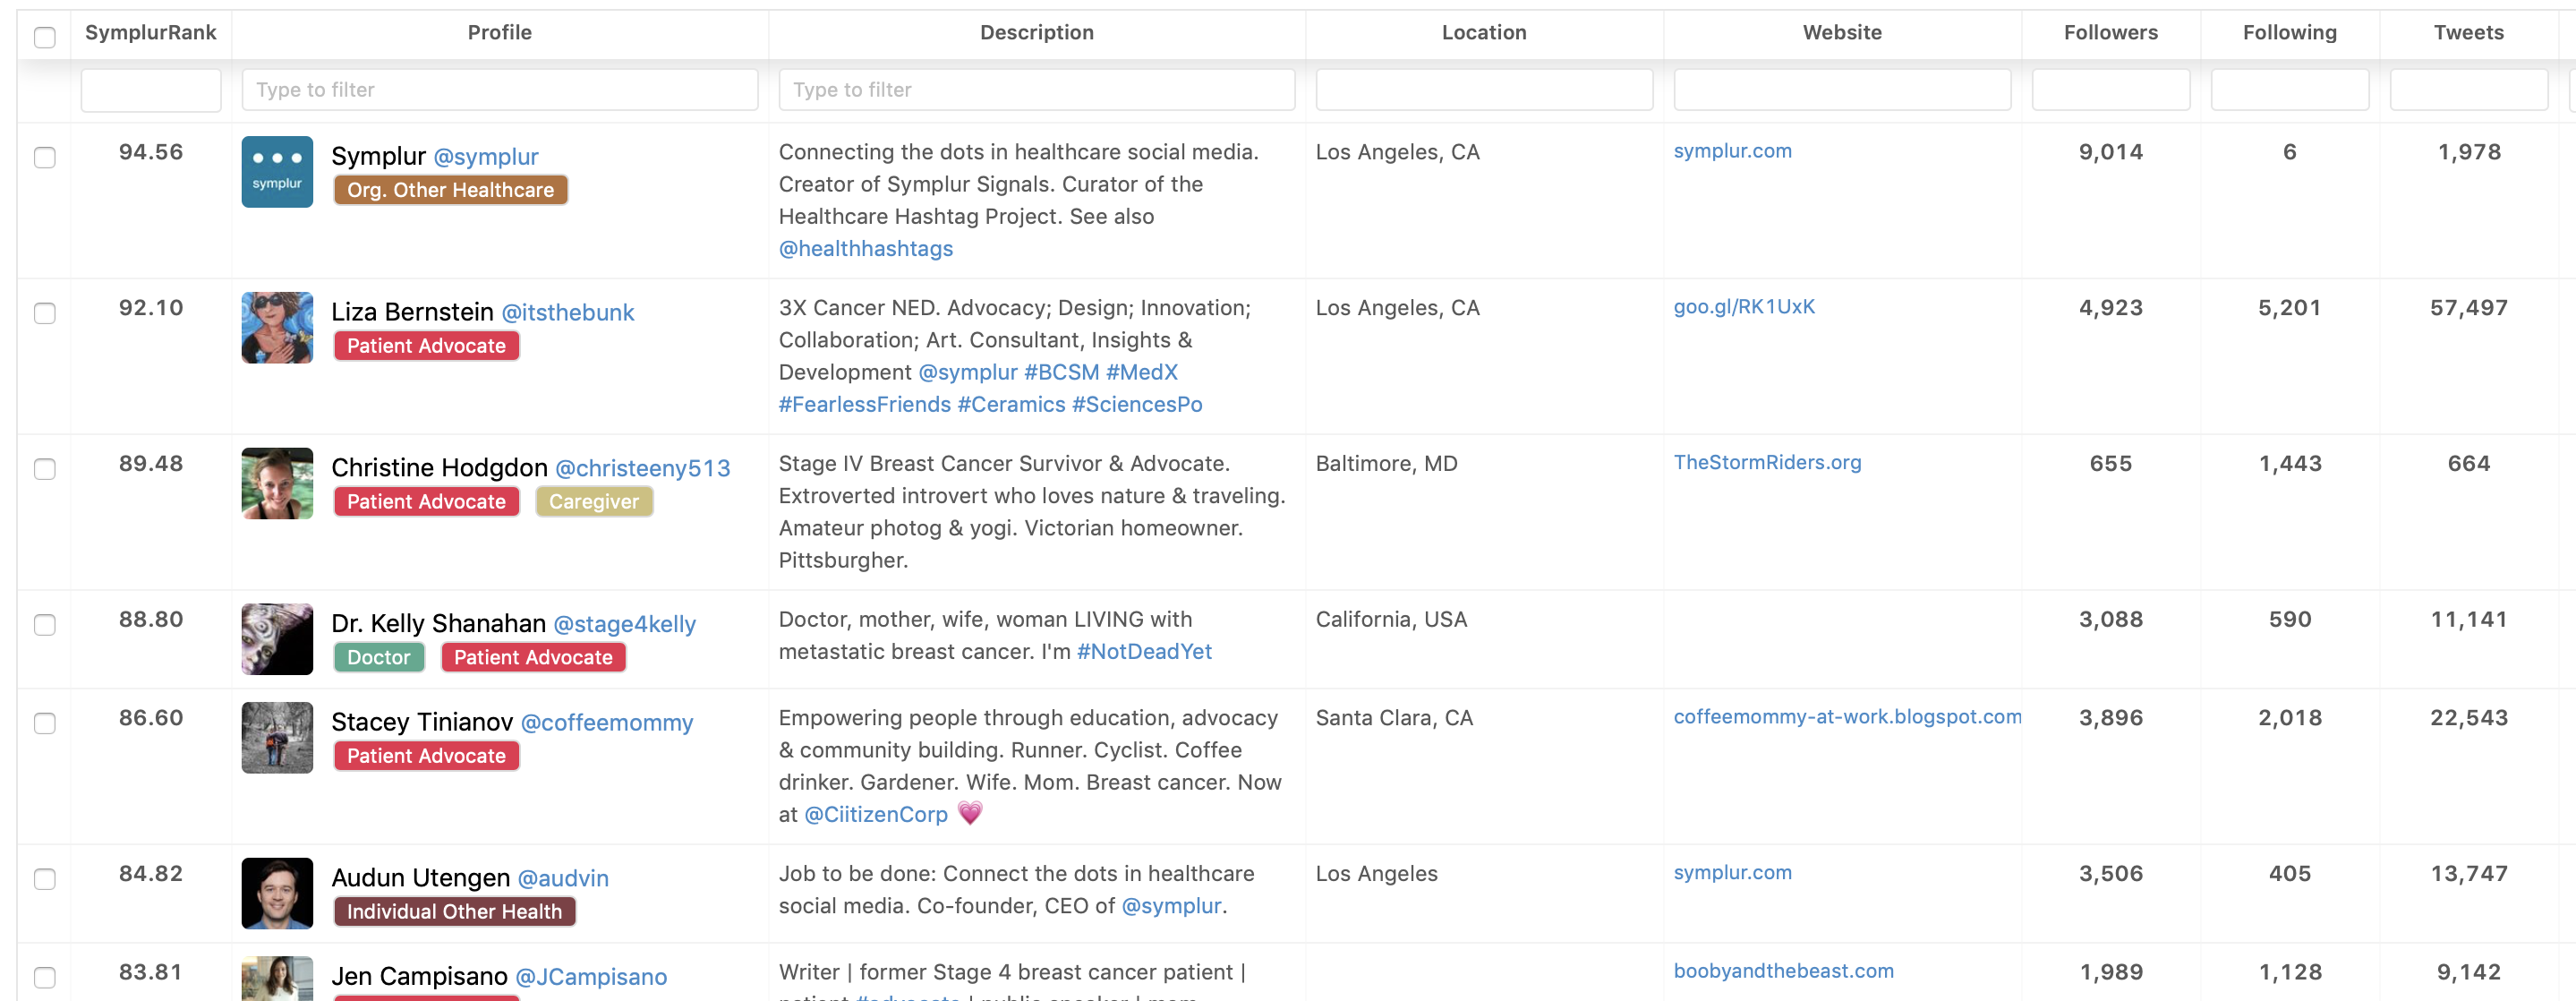
We have released a powerful new feature that enables you to customize the stakeholder segment categorization in your dashboards. This new feature gives you the ability to easily assign or … Continued
In your Dashboard you can now switch to Table view on each widget – giving you additional tools for you to sort and filter the data. To switch to this … Continued
Sign In or Create Symplur Account
This action requires you to be signed into your Symplur Account. It's free to create.